| title | Add Insight widgets to the database management dashboard | Microsoft Docs |
|---|---|
| description | Monitor a database by adding a pre-built query performance widget to the database management dashboard. |
| keywords | |
| ms.custom | tools|sos |
| ms.date | 11/01/2017 |
| ms.prod | sql-non-specified |
| ms.reviewer | alayu; erickang; sanagama; sstein |
| ms.suite | sql |
| ms.tgt_pltfrm | |
| ms.topic | tutorial |
| author | erickangMSFT |
| ms.author | erickang |
| manager | craigg |
| ms.workload | Inactive |
Monitor Query Performance with [!INCLUDEname-sos]
In this tutorial, you walk through the process of adding one of [!INCLUDEname-sos]'s built-in insight widgets to the database dashboard. to quickly view a database's five slowest queries using Query Store. You also learn how to view the details of the slow queries and query plans using [!INCLUDEname-sos]'s features. After following through this tutorial, you will learn how to:
[!div class="checklist"]
- Enable Query Data Store on TutorialDB
- Quickly turn on an insight widget using a built-in insight widget sample.
- View the details of the top five slowest queries.
- Open the query script in editor.
- View query plans.
- Follow [Get Started with [!INCLUDEname-sos]](./get-started-sql-server.md) to a SQL Server 2017 instance and TutorialDB database.
Enable Query Data Store by executing following T-SQL statement on TutorialDB:
ALTER DATABASE TutorialDB SET QUERY_STORE = ONAdd a pre-built management insight to [!INCLUDEname-sos]'s database dashboard
[!INCLUDEname-sos] has a built-in sample widget to monitor the top five slowest query using query performance information collected by Query Data Store. With a few simple steps, you can easily visualize and use the information to improve your database and application.
-
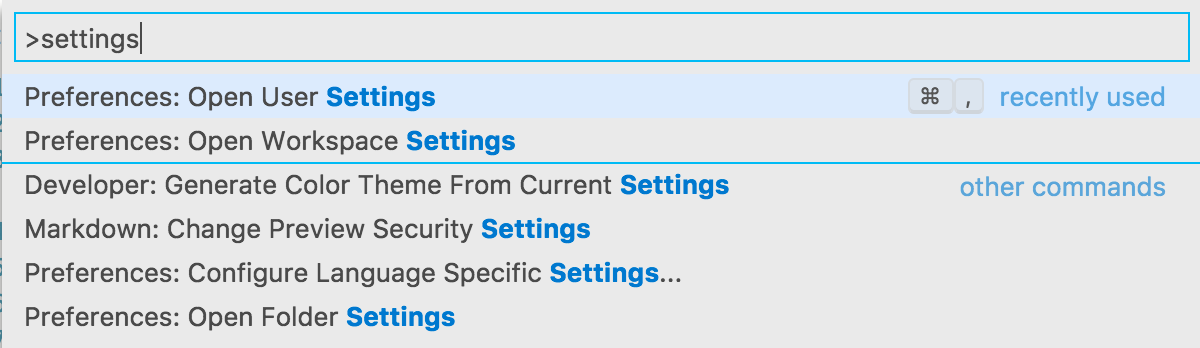
Open User Settings by pressing Ctrl+Shift+P to open the Command Palette.
-
Type settings in the command search input box and select 'Preferences: Open User Settings' command.
-
Type 'dashboard' in Settings Search input box to search "dashboard.database.widgets" in Settings.

-
Click 'Copy to Settings' to copy "dashboard.database.widgets" settings to customize.
-
Using [!INCLUDEname-sos]'s insight settings IntelliSense, configure 'name' for the widget title, 'gridItemConfig' for the widget size, and 'widget' by selecting 'query-data-store-database-insight' from the drop-down list as shown in the screenshot below:

-
Press 'CTRL + s' to save the user's settings file.
-
Open Database dashboard by navigate to 'TutorialDB' in Servers viewlet, and click 'Manage' in the context menu.

-
View 'Top five slowest query insight graph' as shown in the screen shot below:


-
Click 'Show Insight' context menu. It opens Insights detail dialog as shown in the screenshot:

-
Click any item in 'Chart Data' list to show more detail of each item in the list.
-
Select 'query_sql_txt' field in 'Query Data' panel and click 'Copy Selection'.

-
Open a new editor by pressing 'CTRL + N'.
-
Paste the query sql text by pressing 'CTRL + V' in the editor.
-
Click 'Explain' button.

-
View the showplan.


-
Open the insight detail dialog again.
-
Select and copy 'query_plan'

-
Press 'CTRL+N' to open a new editor.
-
Paste the copied plan data to the editor.
-
Press 'CTL + S' to save the file and change the file extension to *.showplan
-
The query plan opens in [!INCLUDEname-sos]'s query plan viewer.
TBD - screenshot

In this tutorial, you learned how to:
[!div class="checklist"]
- Enable Query Data Store on TutorialDB
- Quickly turn on an insight widget using a built-in insight widget sample.
- View the details of the top five slowest queries.
- Open the query script in editor.
- View query plans.
Next, learn how to use X, try this tutorial:
[!div class="nextstepaction"] What article is next in sequence