| title | Monitor database performance using SQL Operations Studio | Microsoft Docs |
|---|---|
| description | Create a database insight widget to monitor query performance using SQL Operations Studio |
| keywords | |
| ms.custom | tools|sos |
| ms.date | 11/03/2017 |
| ms.prod | sql-non-specified |
| ms.reviewer | alayu; erickang; sanagama; sstein |
| ms.suite | sql |
| ms.tgt_pltfrm | |
| ms.topic | tutorial |
| author | erickangMSFT |
| ms.author | erickang |
| manager | craigg |
| ms.workload | Inactive |
Monitor database performance using [!INCLUDEname-sos]
In this tutorial you learn how to locate the five slowest queries, into a database insight widget and add it to the database management dashboard.
In this tutorial, you learn how to:
[!div class="checklist"]
- Locate the top five slowest queries
- Visualize the query results as a chart
- Create a dashboard insight widget from the chart
- Add dashboard insight widgets to the database dashboard
This tutorial requires the TutorialDB database. To create the TutorialDB database, complete one of the following quickstarts:
- [Connect and query SQL Server using [!INCLUDEname-sos-short]](get-started-sql-server.md)
- [Connect and query Azure SQL Database using [!INCLUDEname-sos-short]](get-started-sql-database.md)
- [Connect and query SQL Data Warehouse using [!INCLUDEname-sos-short]](get-started-sql-dw.md)
To identify query performance issues, lets create an insight widget that uses Query Store.
-
Open the SERVERS sidebar (CTRL+G), expand Databases, right-click TutorialDB, and select New Query.
-
Enable Query Store by running the following query:
ALTER DATABASE TutorialDB SET QUERY_STORE=ON
-
Return the five slowest queries by running the following script:
 WITH SlowestQry AS(
     SELECT TOP 5
         p.query_id,
         MAX(rs.max_duration ) max_duration
     FROM sys.query_store_plan AS p
     JOIN sys.query_store_runtime_stats AS rs
         ON p.plan_id = rs.plan_id
     WHERE rs.last_execution_time > DATEADD(week, -1, GETUTCDATE())
     GROUP BY p.query_id
     ORDER BY MAX(rs.max_duration ) DESC)
 SELECT
     p.query_id,  -- legend
     format(rs.last_execution_time,'yyyy-MM-dd hh:mm:ss') as [last_execution_time],   -- x axis
     rs.max_duration,  -- y axis
     p.plan_id
 FROM sys.query_store_plan AS p
     JOIN sys.query_store_runtime_stats AS rs
         ON p.plan_id = rs.plan_id
     JOIN SlowestQry tq
         ON tq.query_id = p.query_id
 WHERE rs.last_execution_time > DATEADD(week, -1, GETUTCDATE())
 order by format(rs.last_execution_time,'yyyy-MM-dd hh:mm:ss')
-
After the results are returned, click View as Chart.

-
For a better visualization of this data, change the chart type to timeSeries, and set Legend Position to top:
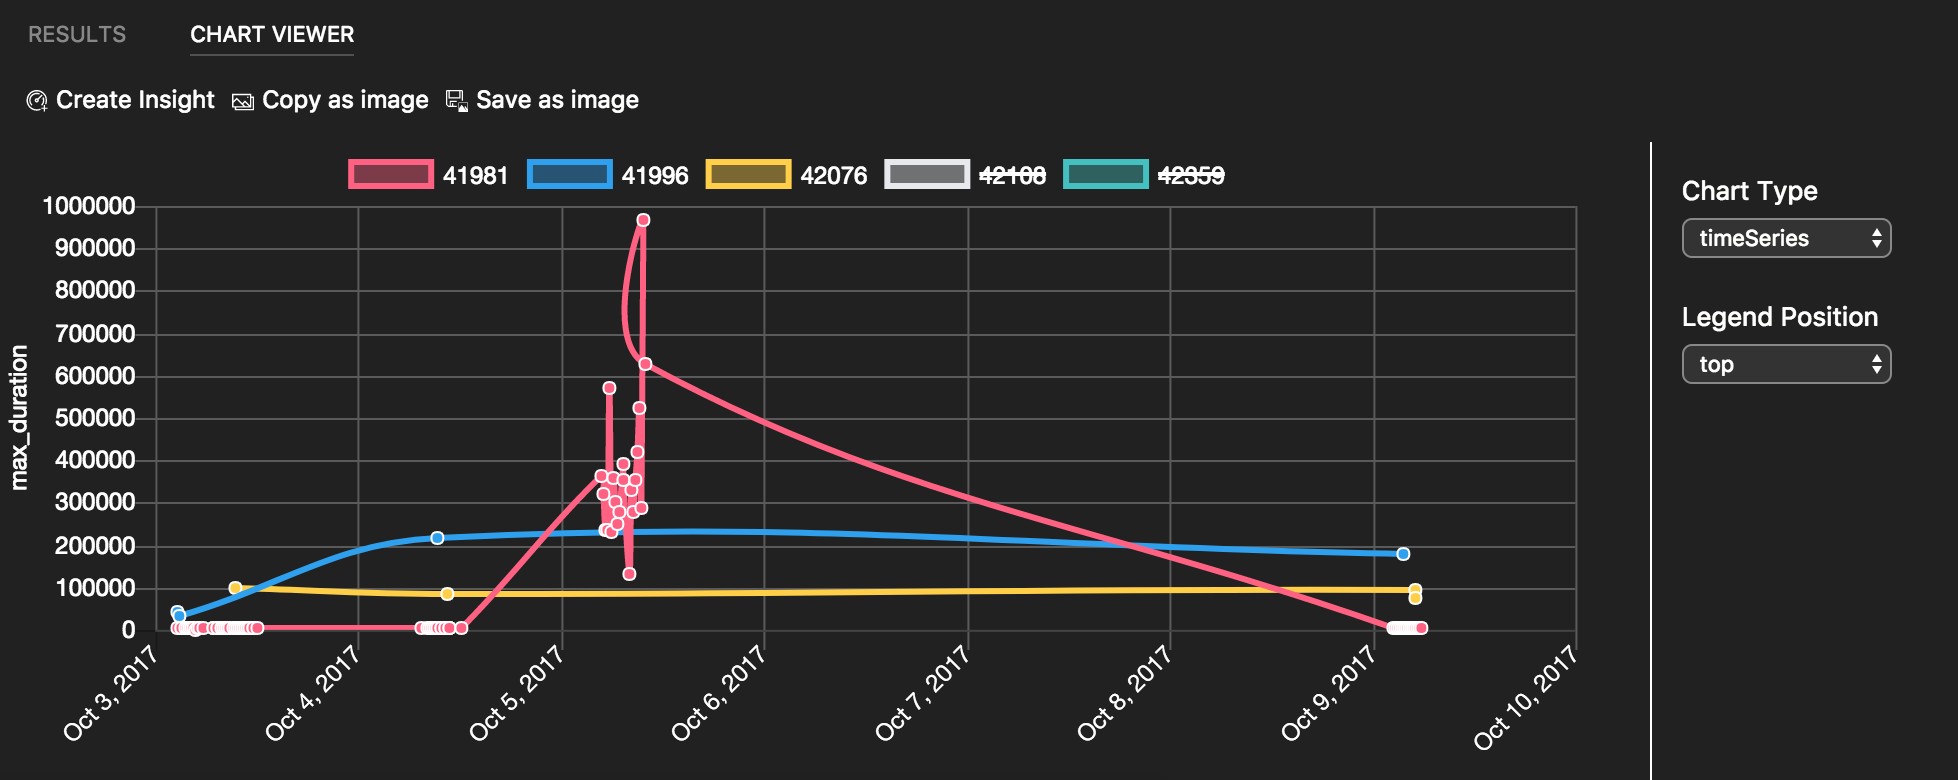
-
Save the script in the editor to a *.sql file. For this tutorial, save the script as qds_insight.sql


Now lets turn the chart from the previous section into a dashboard insight widget.
-
Click Create Insight on Chart Viewer. It opens an insight configuration as JSON:
{ "name": "My-Widget", "gridItemConfig": { "sizex": 2, "sizey": 1 }, "widget": { "insights-widget": { "type": { "timeSeries": { "dataDirection": "horizontal", "dataType": "point", "legendPosition": "top", "labelFirstColumn": false, "columnsAsLabels": false } }, "queryFile": "/Users/myusername/Projects/database_project/qds_insight.sql" } } } -
Copy the insight configuration (the JSON data).
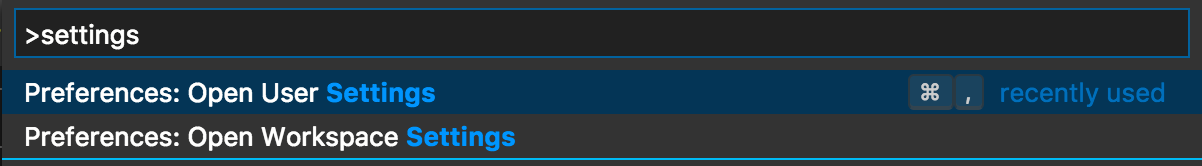
-
Open User Settings by pressing F1 and typing settings in the Command Palette.
-
Type dashboard in Search Settings.
-
Locate dashboard.database.widgets, click Edit, then Copy to Settings.

-
Paste the insight configuration JSON that you copied previously into dashboard.database.widgets. Your settings should look similar to the following JSON block:
 "dashboard.database.widgets": [
     {
         "name": "My-Widget",
         "gridItemConfig": {
             "sizex": 2,
             "sizey": 1
         },
         "widget": {
             "insights-widget": {
                 "type": {
                     "timeSeries": {
                         "dataDirection": "horizontal",
                         "dataType": "point",
                         "legendPosition": "top",
                         "labelFirstColumn": false,
                         "columnsAsLabels": false
                     }
                 },
                 "queryFile": "/Users/myusername/Projects/database_project/qds_insight.sql"
             }
         }
     },
     {
         "name": "Tasks",
         "gridItemConfig": {
             "sizex": 2,
             "sizey": 1
         },
         "widget": {
             "tasks-widget": {}
         }
     },
     {
         "gridItemConfig": {
             "sizex": 2,
             "sizey": 2
         },
         "widget": {
             "explorer-widget": {}
         }
     }
 ]
-
Save the User Settings file.
-
To see the new insight widget, open the Database dashboard for TutorialDB (right-click TutorialDB in the SERVERS sidebar and select Manage).


In this tutorial, you learned how to:
[!div class="checklist"]
- Turn on Query Store
- Locate the five slowest queries
- Visualize query results as a chart
- Create a dashboard insight widget from a query
- Add dashboard insight widgets to the database dashboard
Next, learn how to use X, try this tutorial:
[!div class="nextstepaction"] What article is next in sequence