| title | Monitor Query Performance with SQL Operations Studio | Microsoft Docs |
|---|---|
| description | Monitor a database by adding a pre-built query performance widget to the database dashboard that shows the five slowest queries. |
| keywords | |
| ms.custom | tools|sos |
| ms.date | 11/01/2017 |
| ms.prod | sql-non-specified |
| ms.reviewer | alayu; erickang; sanagama; sstein |
| ms.suite | sql |
| ms.tgt_pltfrm | |
| ms.topic | tutorial |
| author | erickangMSFT |
| ms.author | erickang |
| manager | craigg |
| ms.workload | Inactive |
In this tutorial, you walk through the process of adding one of [!INCLUDEname-sos]'s built-in insight widgets to the database dashboard. to quickly view a database's five slowest queries using Query Store. You also learn how to view the details of the slow queries and query plans using [!INCLUDEname-sos]'s features. During this tutorial, you learn how to:
[!div class="checklist"]
- Enable Query Store on a database
- Add a pre-built insight widget to the database dashboard
- View details about the database's slowest queries
- View query execution plans for the slow queries
This tutorial details the process of adding [!INCLUDEname-sos]'s built-in insight widgets to the database management dashboard.
[!INCLUDEname-sos] includes several insight widgets out-of-the-box. This tutorial shows how to add the query-data-store-db-insight widget, but the steps are basically the same for adding any widget.
This tutorial requires the TutorialDB database. To create the TutorialDB database, complete one of the following quickstarts:
- [Connect and query SQL Server using [!INCLUDEname-sos-short]](get-started-sql-server.md)
- [Connect and query Azure SQL Database using [!INCLUDEname-sos-short]](get-started-sql-database.md)
- [Connect and query SQL Data Warehouse using [!INCLUDEname-sos-short]](get-started-sql-dw.md)
The widget in this example requires Query Store to be enabled so run the following T-SQL statement against your database:
ALTER DATABASE TutorialDB SET QUERY_STORE = ONTo add an insight widget to your dashboard, edit the dashboard.database.widgets setting in your User Settings file.
-
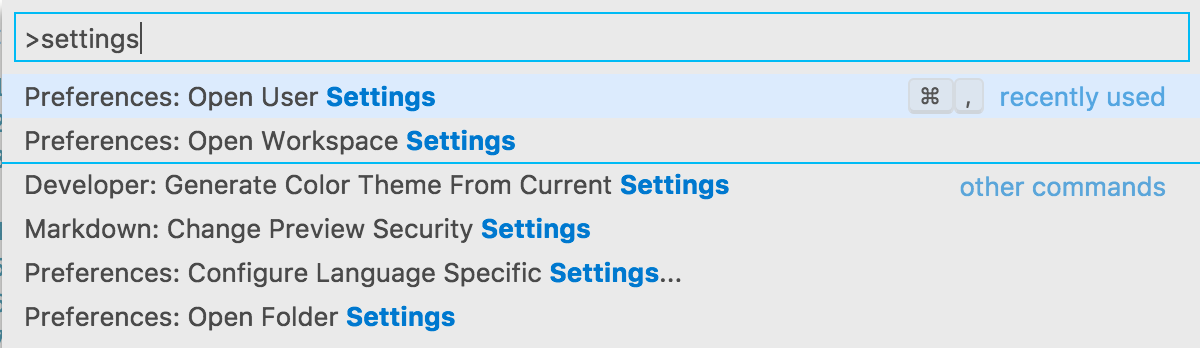
Open User Settings by pressing Ctrl+Shift+P to open the Command Palette.
-
Type settings in the search box and from the available settings files, select Preferences: Open User Settings.
-
Type dashboard in the settings search box and locate the dashboard.database.widgets.

-
To customize the dashboard.database.widgets setting, hover over the pencil icon to the left of the dashboard.database.widgets text, click Edit > Copy to Settings.
-
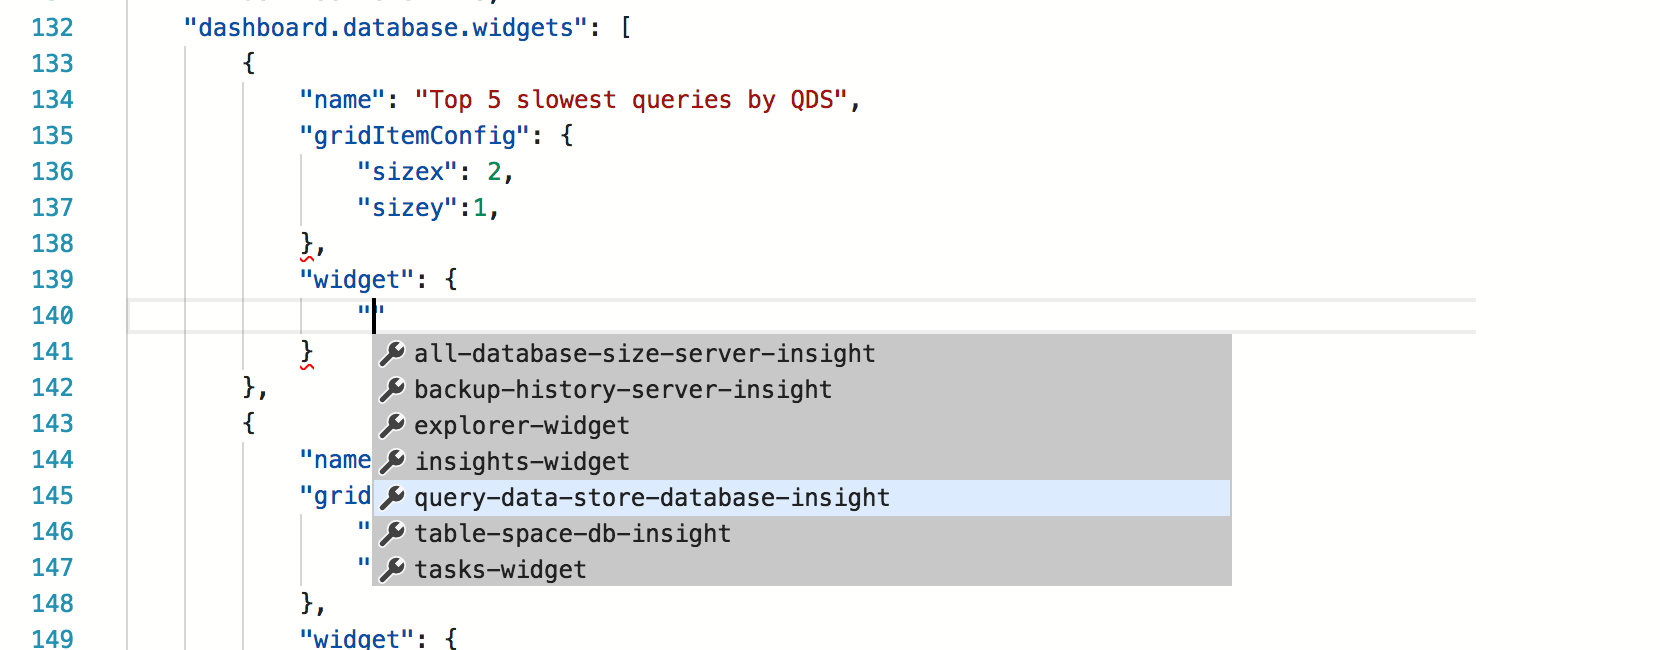
Using [!INCLUDEname-sos]'s insight settings IntelliSense, configure name for the widget title, gridItemConfig for the widget size, and widget by selecting query-data-store-database-insight from the list as shown in the following screenshot:
-
Press CTRL + s to save the modified User Settings.
-
Open the Database dashboard by navigating to TutorialDB in the Servers sidebar, right-click, and select Manage.

-
The insight widget appears on the dashboard:


-
To view additional information for an insight widget, click the ellipses (...) in the upper right, and select Show Details:

-
To show more details for an item, select any item in Chart Data list.
-
Right-click query_sql_txt in Item Details and click Copy Cell.
-
Close the Insights pane.

-
Open a new query editor by pressing Ctrl + N.
-
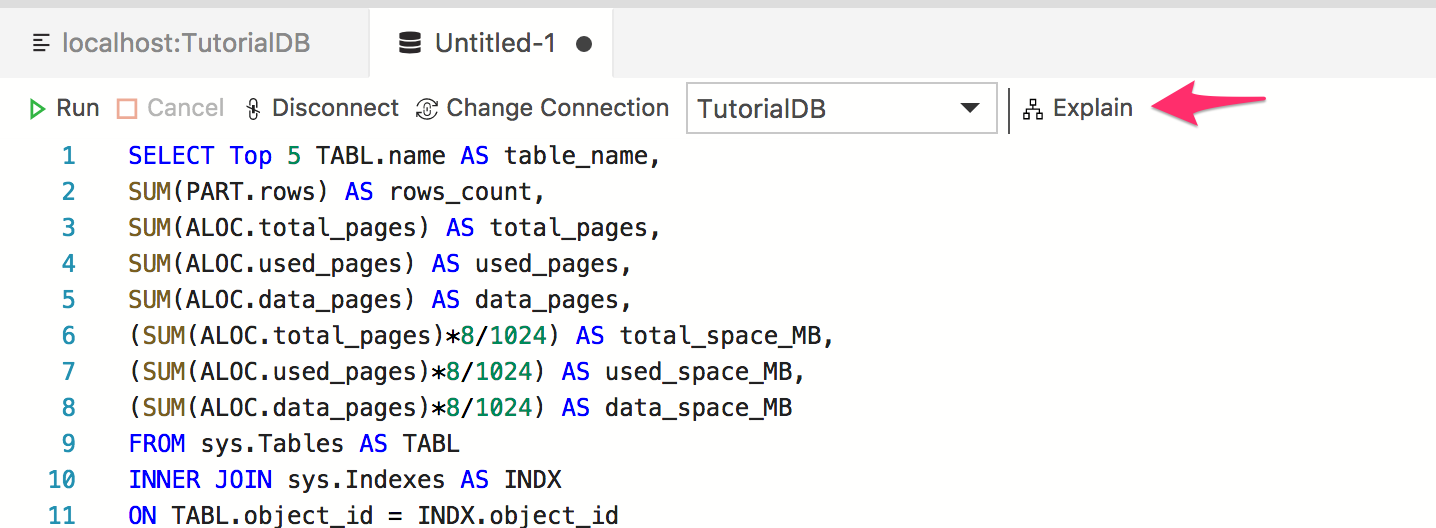
Paste the query_sql_txt from the previous steps into the editor.
-
Click Explain.
-
View the query's execution plan:
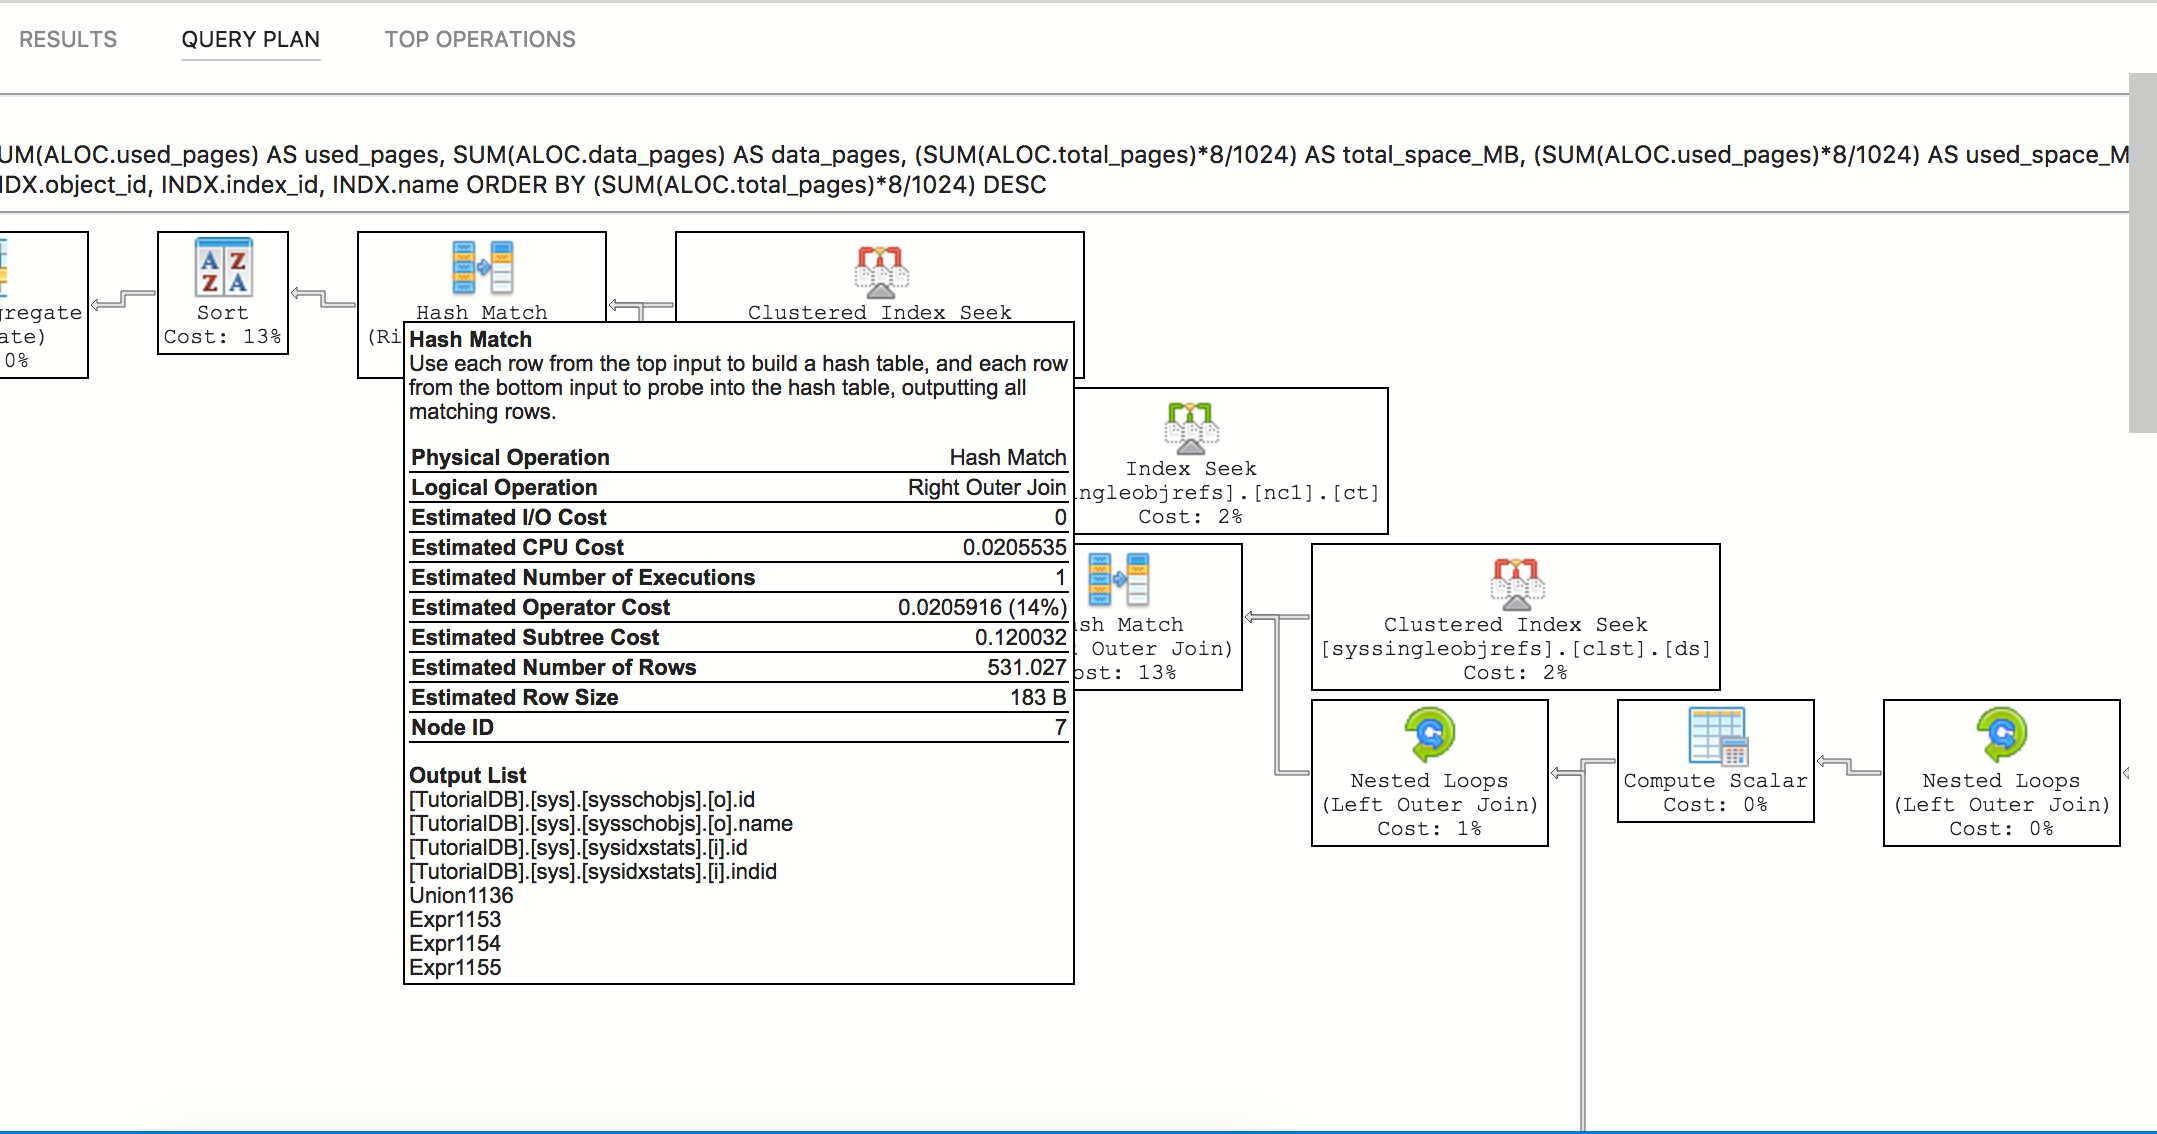


??THIS OPENS AS TEXT FOR ME??
-
Open the insight detail dialog again.
-
Right-click query_plan value and select Copy Cell
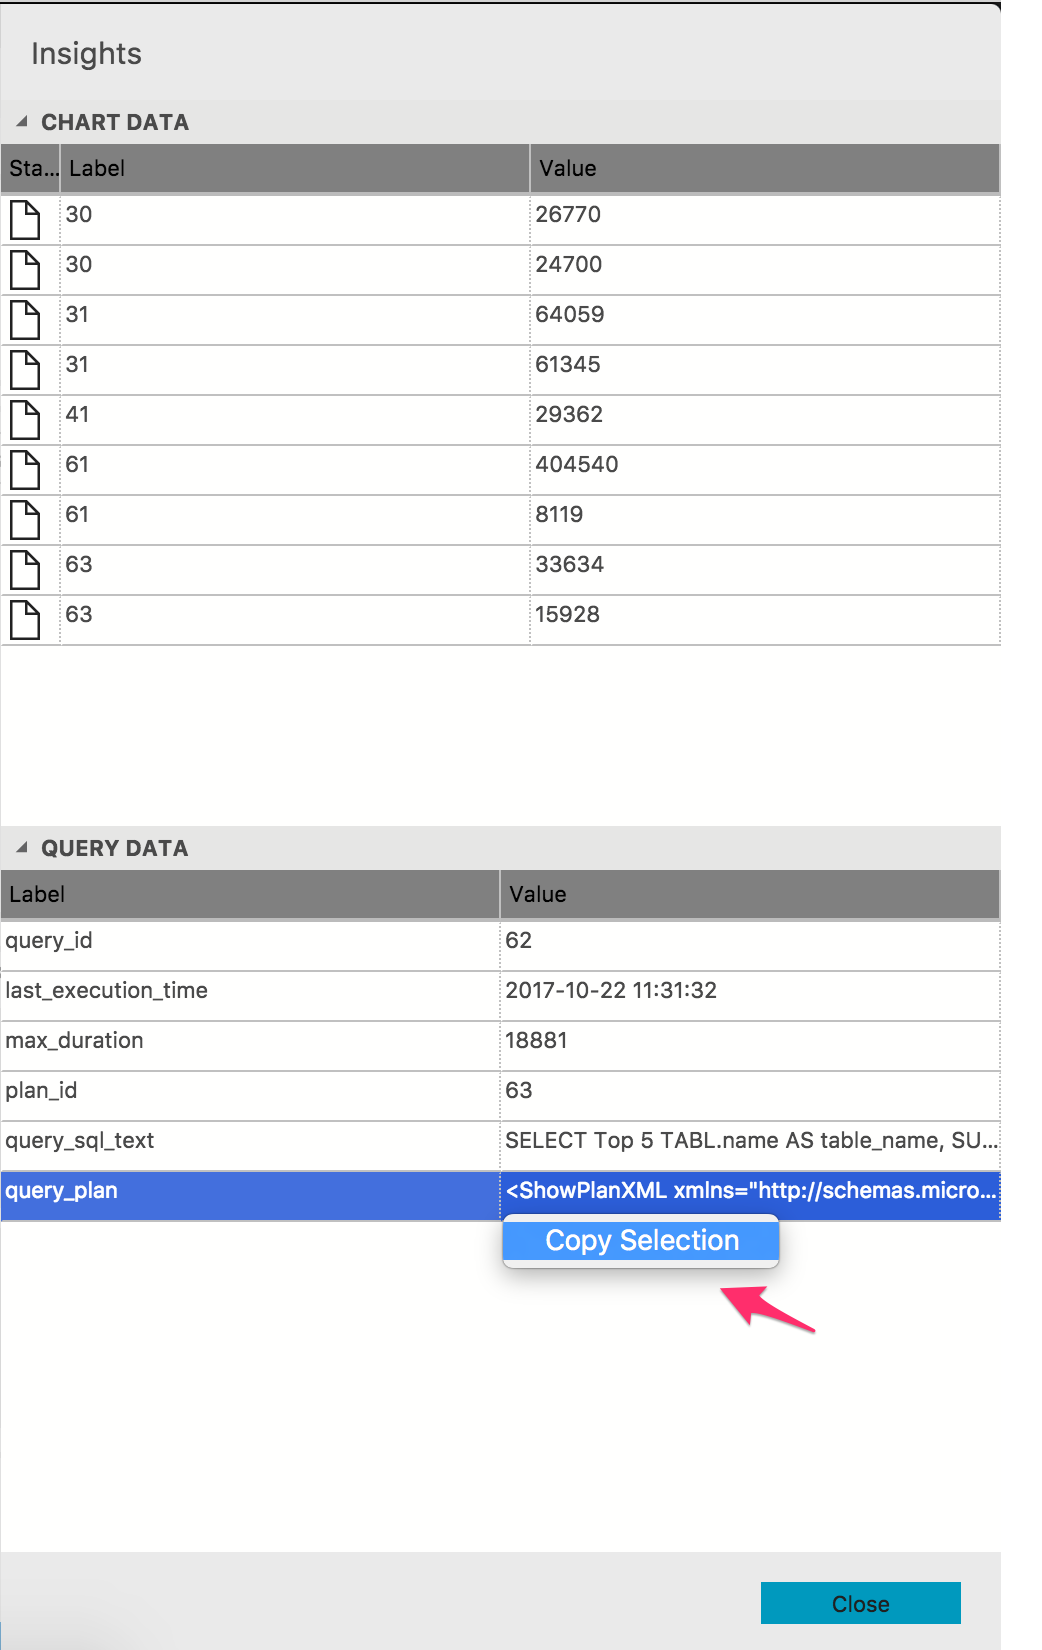
-
Press Ctrl-N to open a new editor.
-
Paste the copied plan into the editor.
-
Press Ctrl-S to save the file, and change the file extension to *.showplan.
-
The query plan opens in [!INCLUDEname-sos]'s query plan viewer.
TBD - screenshot

In this tutorial, you learned how to:
[!div class="checklist"]
- Enable Query Store on a database
- Add an insight widget to the database dashboard
- View details about the database's slowest queries
- View query execution plans for the slow queries
Next, learn how to use X, try this tutorial:
[!div class="nextstepaction"] What article is next in sequence