---
title: View cluster status
titleSuffix: SQL Server big data clusters
description: This article explains how to view the status of a big data cluster using Azure Data Studio, notebooks, and azdata commands.
author: yualan
ms.author: alayu
ms.reviewer: mikeray
ms.date: 11/04/2019
ms.topic: conceptual
ms.prod: sql
ms.technology: big-data-cluster
---
# How to view the status of a big data cluster
[!INCLUDE[tsql-appliesto-ssver15-xxxx-xxxx-xxx](../includes/tsql-appliesto-ssver15-xxxx-xxxx-xxx.md)]
This article describes how to access the service endpoints and view the status of a SQL Server big data cluster components. You can use both Azure Data Studio and **azdata**, and this article covers both techniques.
## Use Azure Data Studio
After downloading the latest **insiders build** of [Azure Data Studio](https://aka.ms/getazuredatastudio), you can view service endpoints and the status of a big data cluster with the SQL Server big data cluster dashboard. Some of the features below are only first available in the insiders build of Azure Data Studio.
1. First, create a connection to your big data cluster in Azure Data Studio. For more information, see [Connect to a SQL Server big data cluster with Azure Data Studio](connect-to-big-data-cluster.md).
1. Right-click on the big data cluster endpoint, and click **Manage**.

1. Select the **SQL Server Big Data Cluster** tab to access the big data cluster dashboard.

### Service endpoints
It is important to be able to easily access the various services within a big data cluster. The big data cluster dashboard provides a service endpoints table that allows you to see and copy the service endpoints.

These services list the endpoints that can be copied and pasted when you need the endpoint for connecting to those services. For example, you can click the copy icon to the right of the endpoint and then paste it in a text window requesting that endpoint. The Cluster Management Service endpoint is necessary to run the [cluster status notebook](#notebook).
### Dashboards
The service endpoints table also exposes several dashboards for monitoring:
- Metrics (Grafana)
- Logs (Kibana)
- Spark Job Monitoring
- Spark Resource Management
You can directly click on these links. You will be required to authenticate when accessing these dashboards. For the metrics and logs dashboards, provide controller admin credentials that you set at deployment time using environment variables **AZDATA_USERNAME** and **AZDATA_PASSWORD**. Spark dashboards will use gateway (Knox) credentials: either AD identity in a cluster integrated with AD or user **root** and **AZDATA_PASSWORD** if using basic authentication in your cluster.
### Cluster Status notebook
1. You can also view cluster status of the big data cluster by launching the Cluster Status notebook. To launch the notebook, click the **Cluster Status** task.

2. Before you begin, you will need the following items:
- Big data cluster name
- Controller username
- Controller password
- Controller endpoints
The default big data cluster name is **mssql-cluster** unless you customized it during your deployment. You can find the controller endpoint from the big data cluster dashboard in the Service Endpoints table. The endpoint is listed as **Cluster Management Service**. If you do not know the credentials, ask the admin who deployed your cluster.
3. Click **Run Cells** on the top toolbar.
4. Follow the prompt for your credentials. Press press ENTER after you type each credential for the big data cluster name, controller username, and controller password.
> [!Note]
> If you do not have a config file setup with your big data, you will be asked for the controller endpoint. Type or paste it, and then press ENTER to proceed.
5. If you connected successfully, the rest of the notebook will show the output of each component of the big data cluster. When you want to rerun a certain code cell, hover over the code cell and click the **Run** icon.
## Use azdata
You can also use [azdata](deploy-install-azdata.md) commands to view both endpoints and the cluster status.
### Service endpoints
1. Log in to the big data cluster with [azdata login](reference-azdata.md). Set the **--controller-endpoint** parameter to the external IP address of the controller endpoint.
```bash
azdata login --endpoint https://:30080 --username
```
Specify the username and password that you configured for the controller (AZDATA_USERNAME and AZDATA_PASSWORD) during deployment.
For AD authentication, the command is:
```bash
azdata login --endpoint https://:30080 --auth ad
```
1. Run [`azdata bdc endpoint list`](reference-azdata-bdc-endpoint.md) to get a list with a description of each endpoint and their corresponding IP address and port values.
```bash
azdata bdc endpoint list -o table
```
The following list shows sample output from this command:
```output
Description Endpoint Ip Name Port Protocol
------------------------------------------------------ --------------------------------------------------------- -------------- ----------------- ------ ----------
Gateway to access HDFS files, Spark https://11.111.111.111:30443 11.111.111.111 gateway 30443 https
Spark Jobs Management and Monitoring Dashboard https://11.111.111.111:30443/gateway/default/sparkhistory 11.111.111.111 spark-history 30443 https
Spark Diagnostics and Monitoring Dashboard https://11.111.111.111:30443/gateway/default/yarn 11.111.111.111 yarn-ui 30443 https
Application Proxy https://11.111.111.111:30778 11.111.111.111 app-proxy 30778 https
Management Proxy https://11.111.111.111:30777 11.111.111.111 mgmtproxy 30777 https
Log Search Dashboard https://11.111.111.111:30777/kibana 11.111.111.111 logsui 30777 https
Metrics Dashboard https://11.111.111.111:30777/grafana 11.111.111.111 metricsui 30777 https
Cluster Management Service https://11.111.111.111:30080 11.111.111.111 controller 30080 https
SQL Server Master Instance Front-End 11.111.111.111,31433 11.111.111.111 sql-server-master 31433 tcp
HDFS File System Proxy https://11.111.111.111:30443/gateway/default/webhdfs/v1 11.111.111.111 webhdfs 30443 https
Proxy for running Spark statements, jobs, applications https://11.111.111.111:30443/gateway/default/livy/v1 11.111.111.111 livy 30443 https
```
### View cluster status
You can view the status of the cluster with the [`azdata bdc status show`](reference-azdata-bdc-status.md) command.
```bash
azdata bdc status show
```
> [!TIP]
> To run the status commands, you must first log in with the **azdata login** command, which was shown in the previous endpoints section.
The following shows sample output from this command:
```output
Bdc: ready Health Status: healthy
===========================================================================================================================================================================================================================================
Services: ready Health Status: healthy
-------------------------------------------------------------------------------------------------------------------------------------------------------------------------------------------------------------------------------------------
Servicename State Healthstatus Details
spark ready healthy -
sql ready healthy -
hdfs ready healthy -
control ready healthy -
gateway ready healthy -
app ready healthy -
Spark Services: ready Health Status: healthy
-------------------------------------------------------------------------------------------------------------------------------------------------------------------------------------------------------------------------------------------
Resourcename State Healthstatus Details
sparkhead ready healthy StatefulSet sparkhead is healthy
storage-0 ready healthy StatefulSet storage-0 is healthy
Sql Services: ready Health Status: healthy
-------------------------------------------------------------------------------------------------------------------------------------------------------------------------------------------------------------------------------------------
Resourcename State Healthstatus Details
master ready healthy StatefulSet master is healthy
compute-0 ready healthy StatefulSet compute-0 is healthy
data-0 ready healthy StatefulSet data-0 is healthy
storage-0 ready healthy StatefulSet storage-0 is healthy
Hdfs Services: ready Health Status: healthy
-------------------------------------------------------------------------------------------------------------------------------------------------------------------------------------------------------------------------------------------
Resourcename State Healthstatus Details
nmnode-0 ready healthy StatefulSet nmnode-0 is healthy
zookeeper ready healthy StatefulSet zookeeper is healthy
storage-0 ready healthy StatefulSet storage-0 is healthy
sparkhead ready healthy StatefulSet sparkhead is healthy
Control Services: ready Health Status: healthy
-------------------------------------------------------------------------------------------------------------------------------------------------------------------------------------------------------------------------------------------
Resourcename State Healthstatus Details
controldb ready healthy StatefulSet controldb is healthy
control ready healthy ReplicaSet control is healthy
metricsdc ready healthy DaemonSet metricsdc is healthy
metricsui ready healthy ReplicaSet metricsui is healthy
metricsdb ready healthy StatefulSet metricsdb is healthy
logsui ready healthy ReplicaSet logsui is healthy
logsdb ready healthy StatefulSet logsdb is healthy
mgmtproxy ready healthy ReplicaSet mgmtproxy is healthy
controlwd ready healthy ReplicaSet controlwd is healthy
Gateway Services: ready Health Status: healthy
-------------------------------------------------------------------------------------------------------------------------------------------------------------------------------------------------------------------------------------------
Resourcename State Healthstatus Details
gateway ready healthy StatefulSet gateway is healthy
App Services: ready Health Status: healthy
-------------------------------------------------------------------------------------------------------------------------------------------------------------------------------------------------------------------------------------------
Resourcename State Healthstatus Details
appproxy ready healthy ReplicaSet appproxy is healthy
```
### View specific resource status
You can view the status of a specific resource within the cluster with the [azdata bdc status show](reference-azdata-bdc-status.md) command. When you use this command you can filter using `--resource` parameter. Few examples of inputs for `--resource` parameter are:
- master
- control
- compute-0
- storage-0
- gateway
For example, the following command displays the status of the storage pool:
```bash
azdata bdc status show --all --resource storage-0
```
To see the status of all components that are running a specific service you must use the corresponding command group `azdata bdc status show`. For example:
- azdata bdc sql status show --all
- azdata bdc hdfs status show --all
- azdata bdc spark status show --all
Here is an sample output:
```output
Storage-0: ready Health Status: healthy
===========================================================================================================================================================================================================================================
Instances: running Health Status: healthy
-------------------------------------------------------------------------------------------------------------------------------------------------------------------------------------------------------------------------------------------
Instancename State Healthstatus Details
storage-0-0 running healthy Pod storage-0-0 is healthy
storage-0-1 running healthy Pod storage-0-1 is healthy
Dashboards
-------------------------------------------------------------------------------------------------------------------------------------------------------------------------------------------------------------------------------------------
Name Url
nodeMetricsUrl https://13.91.50.9:30777/api/v1/bdc/instances/storage-0-1/status/nodemetrics/ui
sqlMetricsUrl https://13.91.50.9:30777/api/v1/bdc/instances/storage-0-1/status/sqlmetrics/ui
logsUrl https://13.91.50.9:30777/api/v1/bdc/instances/storage-0-1/status/logs/ui
```
> [!TIP]
> Run the status command with `--all` parameters for additional health details, including links to metrics and logs dashboards corresponding to the specific instance. Here is a sample output when the `--all` parameters is used:
```output
Spark: ready Health Status: healthy
===========================================================================================================================================================================================================================================
Resources: ready Health Status: healthy
-------------------------------------------------------------------------------------------------------------------------------------------------------------------------------------------------------------------------------------------
Resourcename State Healthstatus Details
sparkhead ready healthy StatefulSet sparkhead is healthy
storage-0 ready healthy StatefulSet storage-0 is healthy
Sparkhead Resources: running Health Status: healthy
-------------------------------------------------------------------------------------------------------------------------------------------------------------------------------------------------------------------------------------------
Instancename State Healthstatus Details
sparkhead-0 running healthy Pod sparkhead-0 is healthy
sparkhead-1 running healthy Pod sparkhead-1 is healthy
Dashboards
--------------------------------------------------------------------------------------------------------------------------------------------------------------------------------------------------------------------------------------
Name Url
nodeMetricsUrl https://13.91.50.9:30777/api/v1/bdc/instances/sparkhead-1/status/nodemetrics/ui
sqlMetricsUrl https://13.91.50.9:30777/api/v1/bdc/instances/sparkhead-1/status/sqlmetrics/ui
logsUrl https://13.91.50.9:30777/api/v1/bdc/instances/sparkhead-1/status/logs/ui
Storage-0 Resources: running Health Status: healthy
-------------------------------------------------------------------------------------------------------------------------------------------------------------------------------------------------------------------------------------------
Instancename State Healthstatus Details
storage-0-0 running healthy Pod storage-0-0 is healthy
storage-0-1 running healthy Pod storage-0-1 is healthy
Dashboards
--------------------------------------------------------------------------------------------------------------------------------------------------------------------------------------------------------------------------------------
Name Url
nodeMetricsUrl https://13.91.50.9:30777/api/v1/bdc/instances/storage-0-1/status/nodemetrics/ui
sqlMetricsUrl https://13.91.50.9:30777/api/v1/bdc/instances/storage-0-1/status/sqlmetrics/ui
logsUrl https://13.91.50.9:30777/api/v1/bdc/instances/storage-0-1/status/logs/ui
```
The `logsUrl` value links to a Kibana dashboard:

> [!NOTE]
> (Old) Microsoft Edge browser ios incompatible with Kibana, you must use the chromium based browser for the dashboard to display correctly. You will see a blank page when loading the dashboards using an unsupported browser. See here for supported browsers for Kibana.
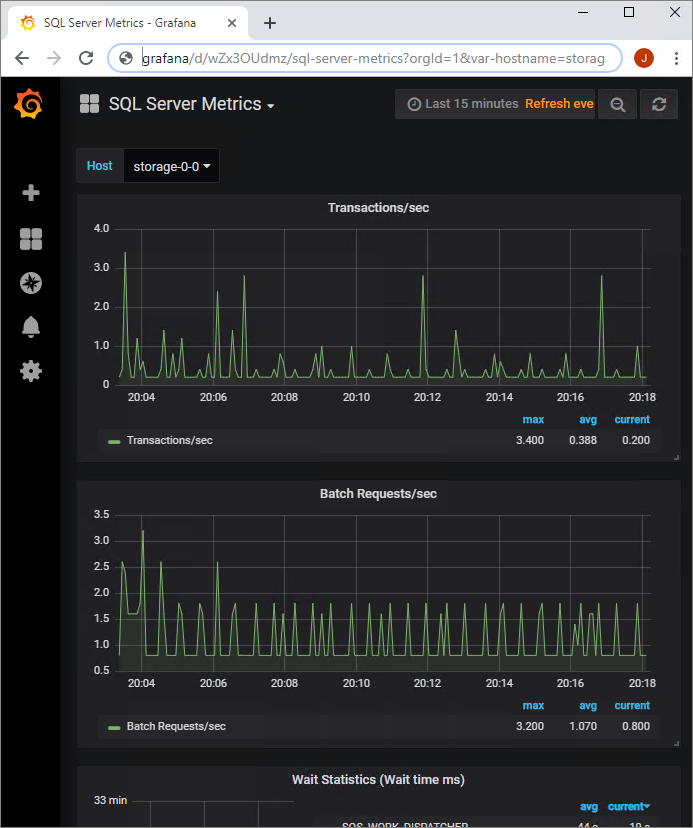
The `nodeMetricsUrl` and `sqlMetricsUrl` values link to a Grafana dashboard for monitoring Kubernetes node metrics and big data cluster service metrics:

### View controller status
You can view the controller status with the [`azdata bdc control status show`](reference-azdata-bdc-control-status.md) command. It provides similar links to the monitoring dashboards related to the controller components of the big data cluster.
## Next steps
For more information about big data clusters, see [What are [!INCLUDE[big-data-clusters-2019](../includes/ssbigdataclusters-ss-nover.md)]](big-data-cluster-overview.md).