| title | Enable Table Space Usage Insight Dashboard | Microsoft Docs |
|---|---|
| description | This sample describes the article in 115 to 145 characters. Validate using Gauntlet toolbar check icon. Use SEO kind of action verbs here. |
| keywords | |
| ms.custom | tools|sos |
| ms.date | 11/01/2017 |
| ms.prod | sql-non-specified |
| ms.reviewer | alayu; erickang; sanagama; sstein |
| ms.suite | sql |
| ms.tgt_pltfrm | |
| ms.topic | tutorial |
| author | erickangMSFT |
| ms.author | erickang |
| manager | craigg |
| ms.workload | Inactive |
In this tutorial, we will walk-through how to enable an insight widget on Dashboard to get an at-a-glance view about the space usage for all tables in a database. After following through this tutorial, you will learn learn how to:
[!div class="checklist"]
- Quickly turn on an insight widget using a built-in insight widget sample.
- View the details of table space usage.
- Filter data and view label detail on an insight chart
- Follow Get Started with Carbon to a SQL Server 2017 instance and TutorialDB database.
Carbon has a built-in sample widget to monitor the space used by tables in a database.
-
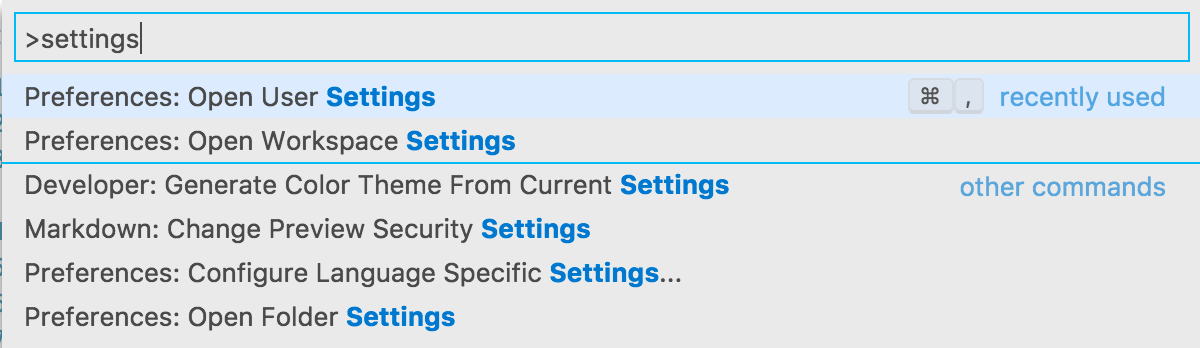
Open User Settings by pressing 'F1' to open Command Palette, type in 'settings' in the command search input box and select 'Preferences: Open User Settings' command.
-
Type 'dashboard' in Settings Search input box to search "dashboard.database.widgets" in Settings.

-
Click 'Copy to Settings' to copy "dashboard.database.widgets" settings to customize.
-
Using Carbon's insight settings IntelliSense, configure 'name' for the widget title, 'gridItemConfig' for the widget size, and 'widget' by selecting 'table-space-database-insight' from the drop down list as shown in the screenshot below:

-
Press 'CTRL + S' to save the user's settings file.
-
Open Database dashboard by navigate to 'TutorialDB' in Servers viewlet, and click 'Manage' in the context menu.

-
View 'Space used by tables' as shown in the screen shot below:


Carbon's insight chart provides filtering and mouse-hover detail view functionality. To try out follow the steps below:
-
Click and toggle 'row_count' legend on the chart. Carbon shows and hides data seriese as user toggle on or off a legend.
-
Hover the mouse pointer over a chart. Carbon shows more information about the data series label and its value as shown on the screenshot.


In this tutorial, you learned how to:
[!div class="checklist"]
- Quickly turn on an insight widget using a built-in insight widget sample.
- View the details of table space usage.
- Filter data and view label detail on an insight chart
Next, learn how to use X, try this tutorial:
[!div class="nextstepaction"] What article is next in sequence