| title | Tutorial: Monitor Query Performance with SQL Operations Studio (preview) | Microsoft Docs |
|---|---|
| description | This tutorial demonstrates how to monitor a database by adding a pre-built query performance widget to the database dashboard that shows the five slowest queries. |
| keywords | |
| ms.custom | tools|sos |
| ms.date | 11/08/2017 |
| ms.prod | sql-non-specified |
| ms.reviewer | alayu; erickang; sstein |
| ms.suite | sql |
| ms.tgt_pltfrm | |
| ms.topic | tutorial |
| author | erickangMSFT |
| ms.author | erickang |
| manager | craigg |
| ms.workload | Inactive |
This tutorial demonstrates the process of adding one of [!INCLUDEname-sos]'s built-in insight widgets to the database dashboard to quickly view a database's five slowest queries. You also learn how to view the details of the slow queries and query plans using [!INCLUDEname-sos]'s features. During this tutorial, you learn how to:
[!div class="checklist"]
- Enable Query Store on a database
- Add a pre-built insight widget to the database dashboard
- View details about the database's slowest queries
- View query execution plans for the slow queries
[!INCLUDEname-sos] includes several insight widgets out-of-the-box. This tutorial shows how to add the query-data-store-db-insight widget, but the steps are basically the same for adding any widget.
This tutorial requires the SQL Server or Azure SQL Database TutorialDB. To create the TutorialDB database, complete one of the following quickstarts:
- [Connect and query SQL Server using [!INCLUDEname-sos-short]](quickstart-sql-server.md)
- [Connect and query Azure SQL Database using [!INCLUDEname-sos-short]](quickstart-sql-database.md)
The widget in this example requires Query Store to be enabled so run the following T-SQL statement against your database:
ALTER DATABASE TutorialDB SET QUERY_STORE = ONTo add an insight widget to your dashboard, edit the dashboard.database.widgets setting in your User Settings file.
-
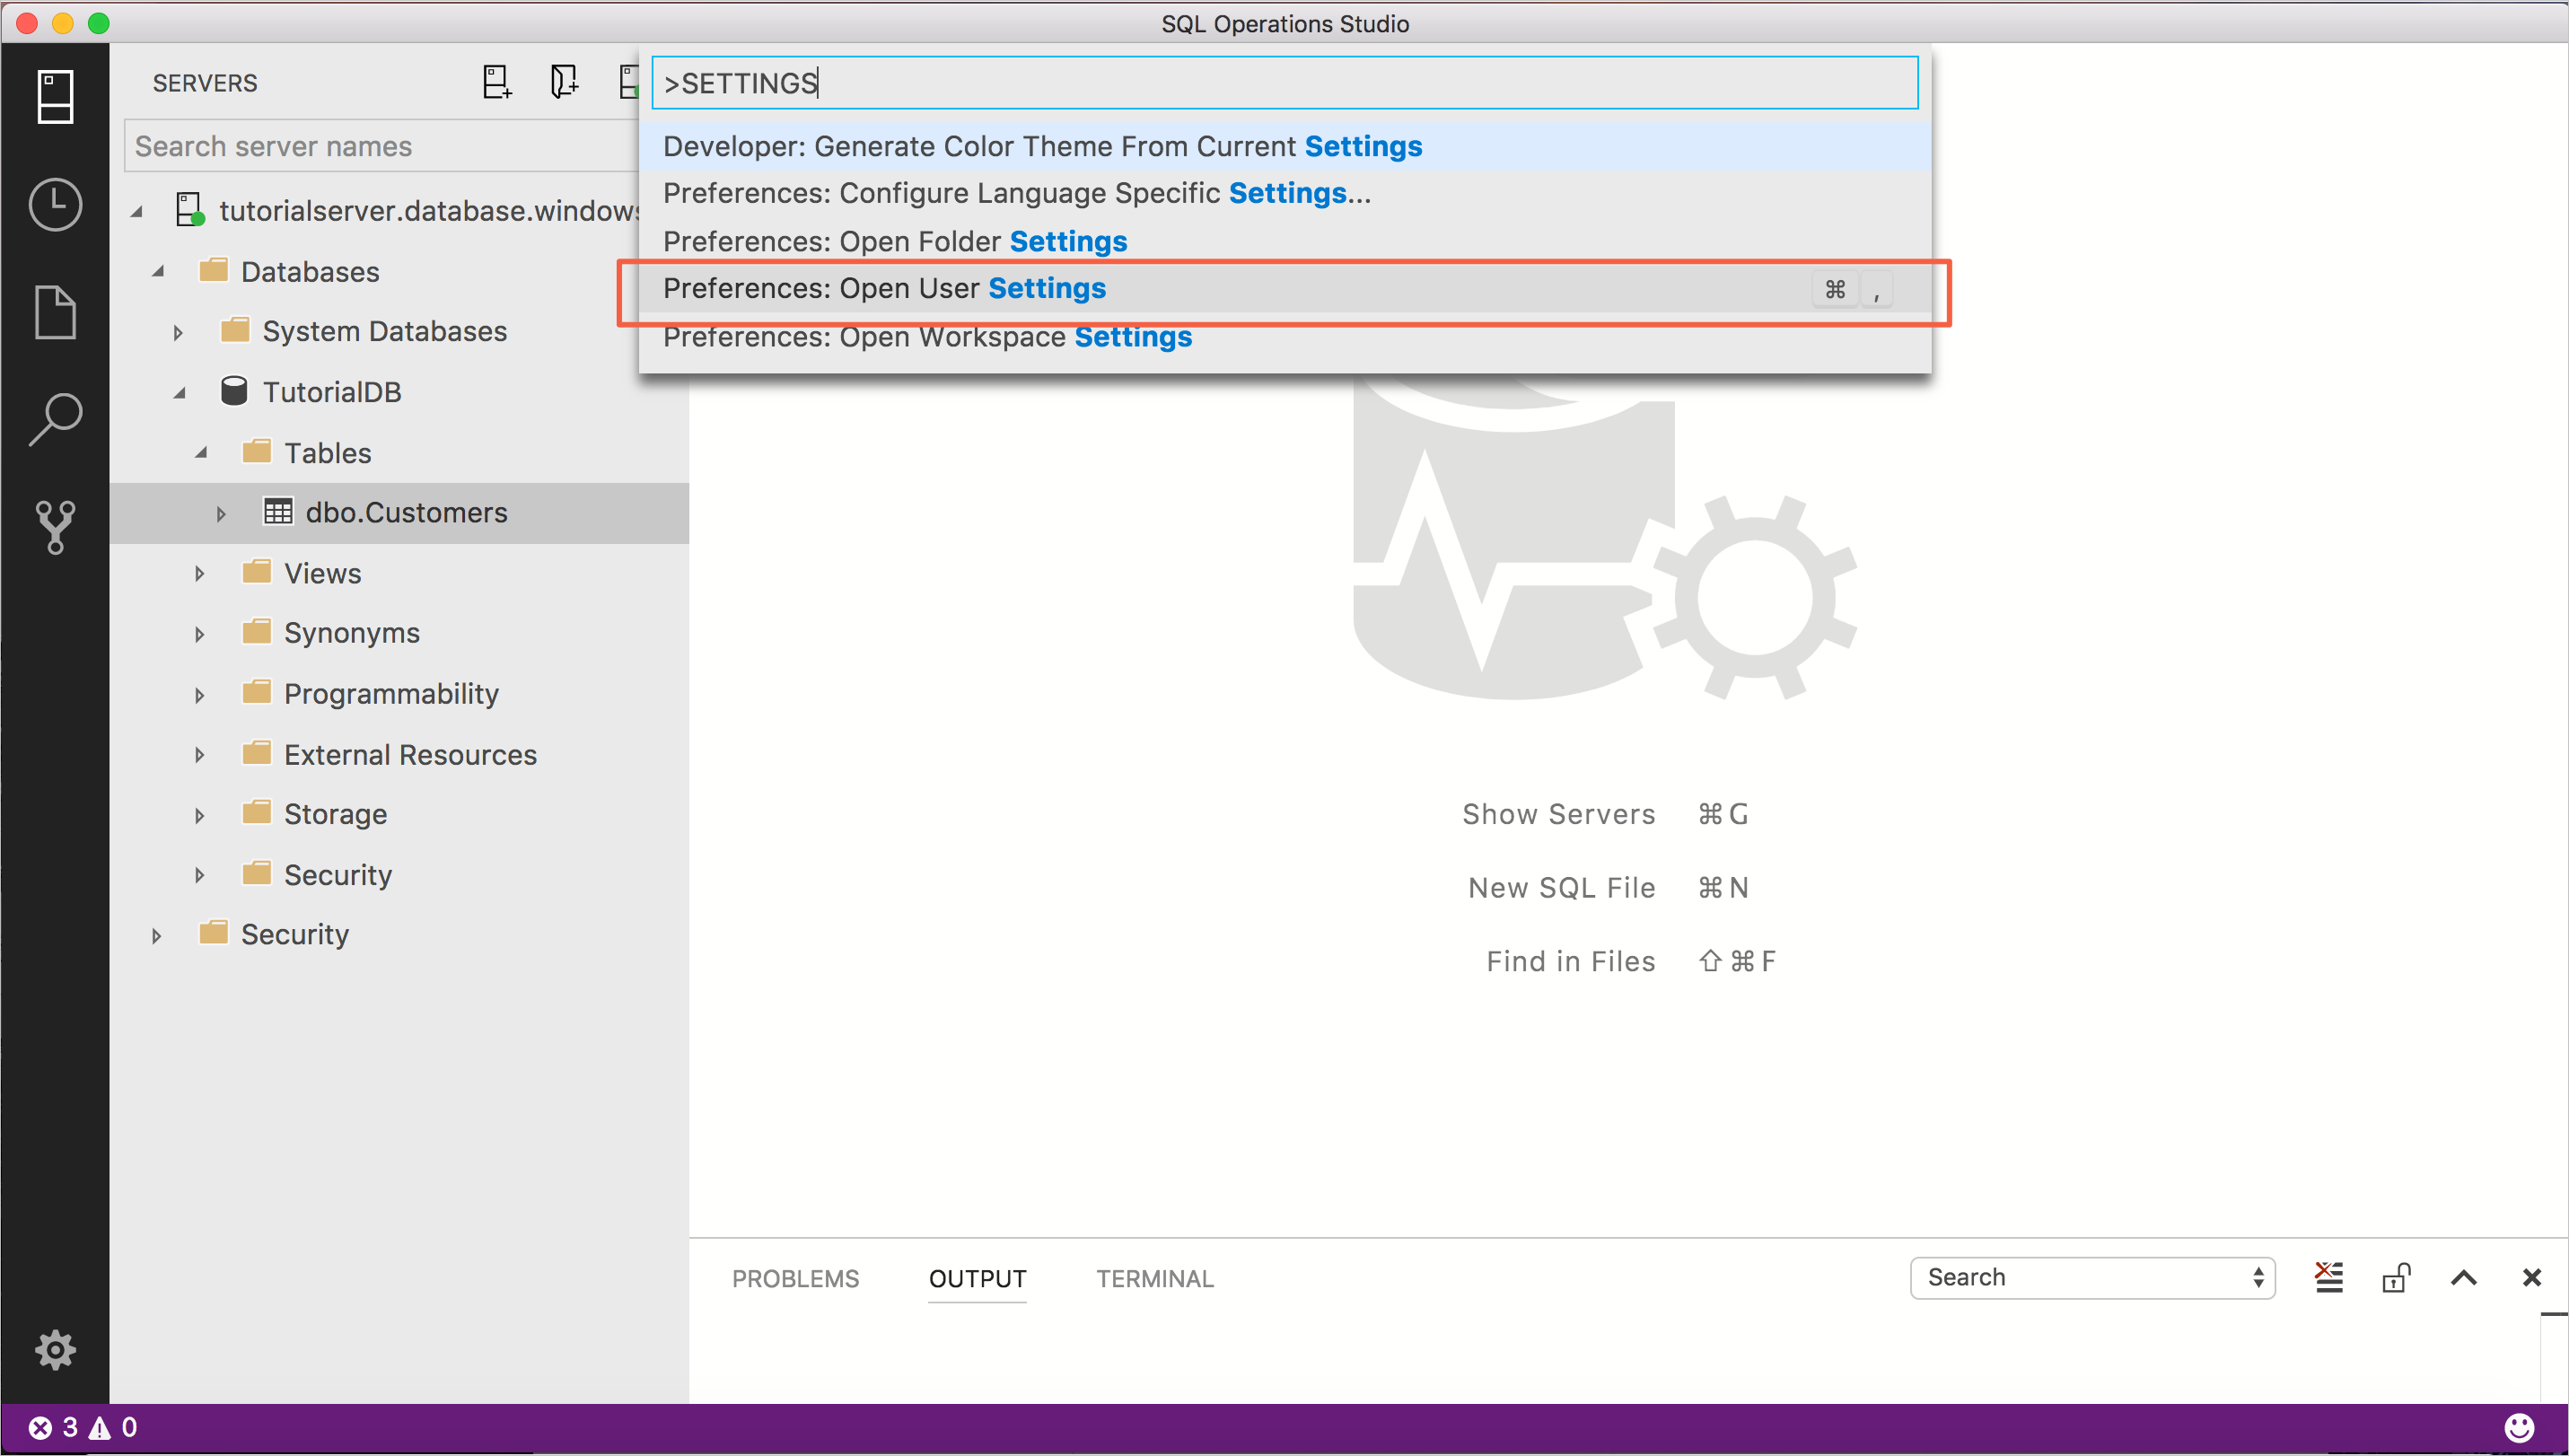
Open User Settings by pressing Ctrl+Shift+P to open the Command Palette.
-
Type settings in the search box and from the available settings files, select Preferences: Open User Settings.
-
Type dashboard in the settings search box and locate dashboard.database.widgets.
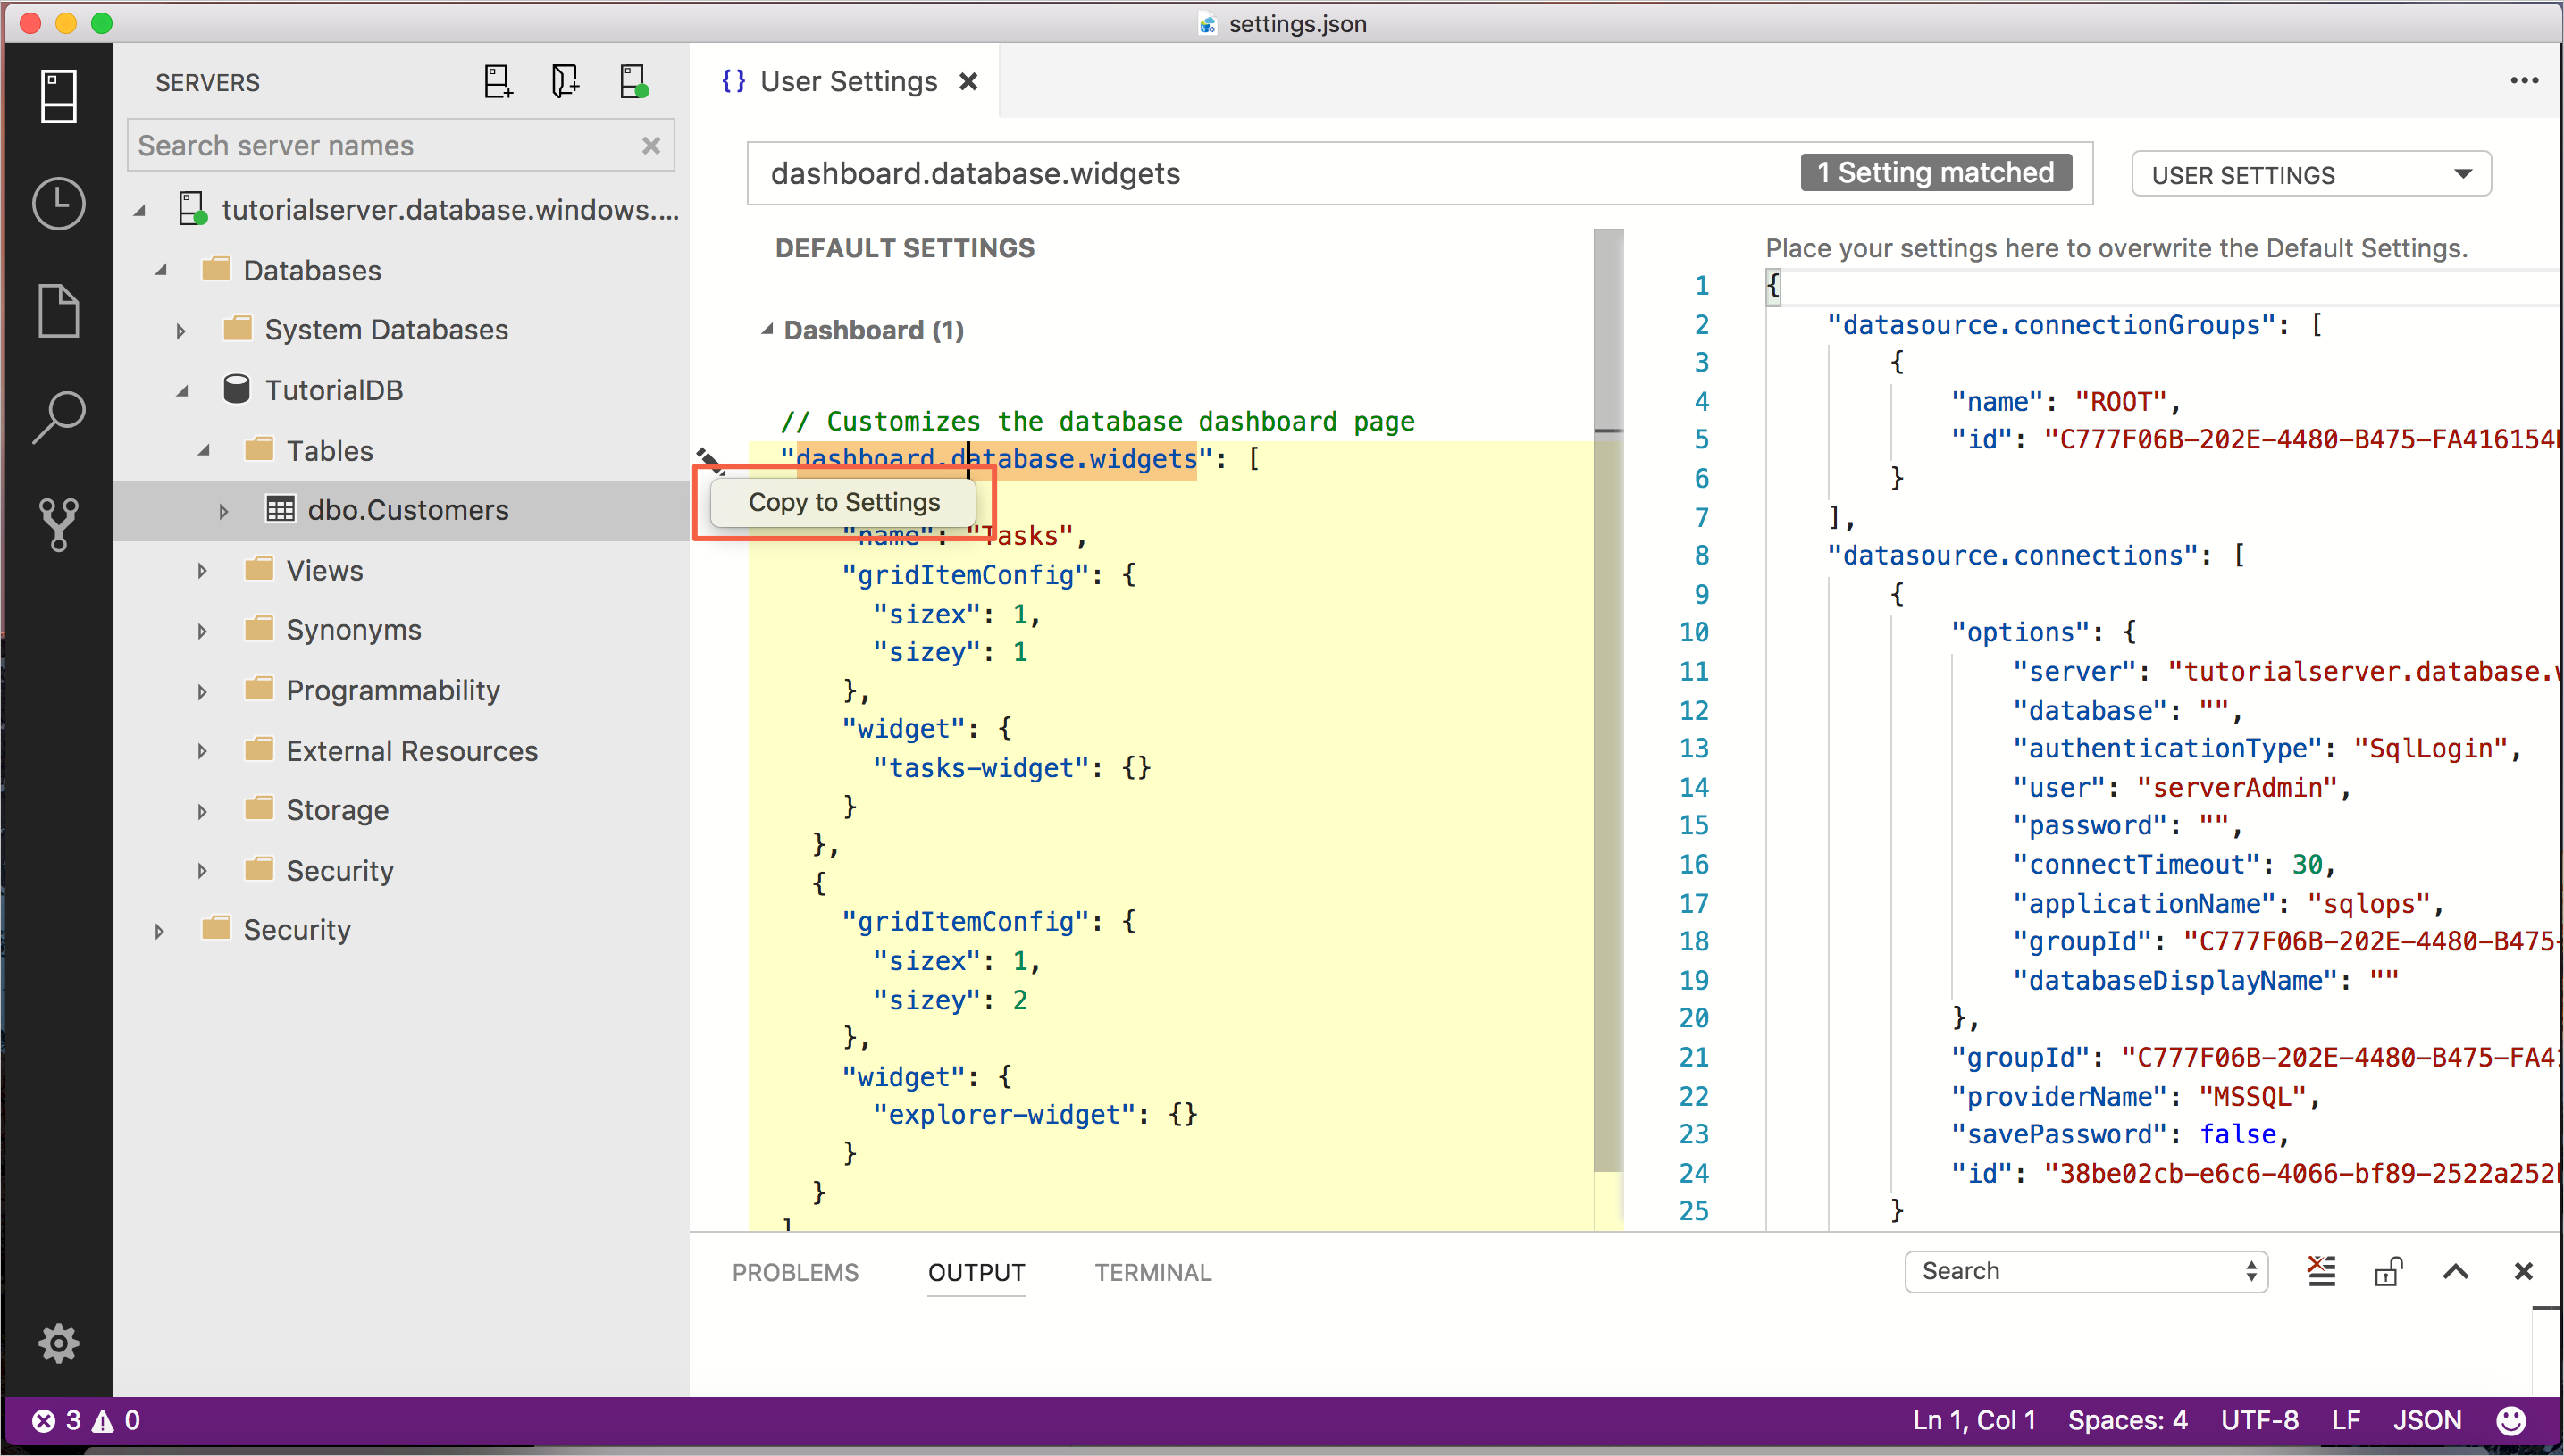
-
To customize the dashboard.database.widgets setting, hover over the pencil icon to the left of the dashboard.database.widgets text, click Edit > Copy to Settings.
-
Using [!INCLUDEname-sos]'s insight settings IntelliSense, configure name for the widget title, gridItemConfig for the widget size, and widget by selecting query-data-store-db-insight from the list as shown in the following screenshot:
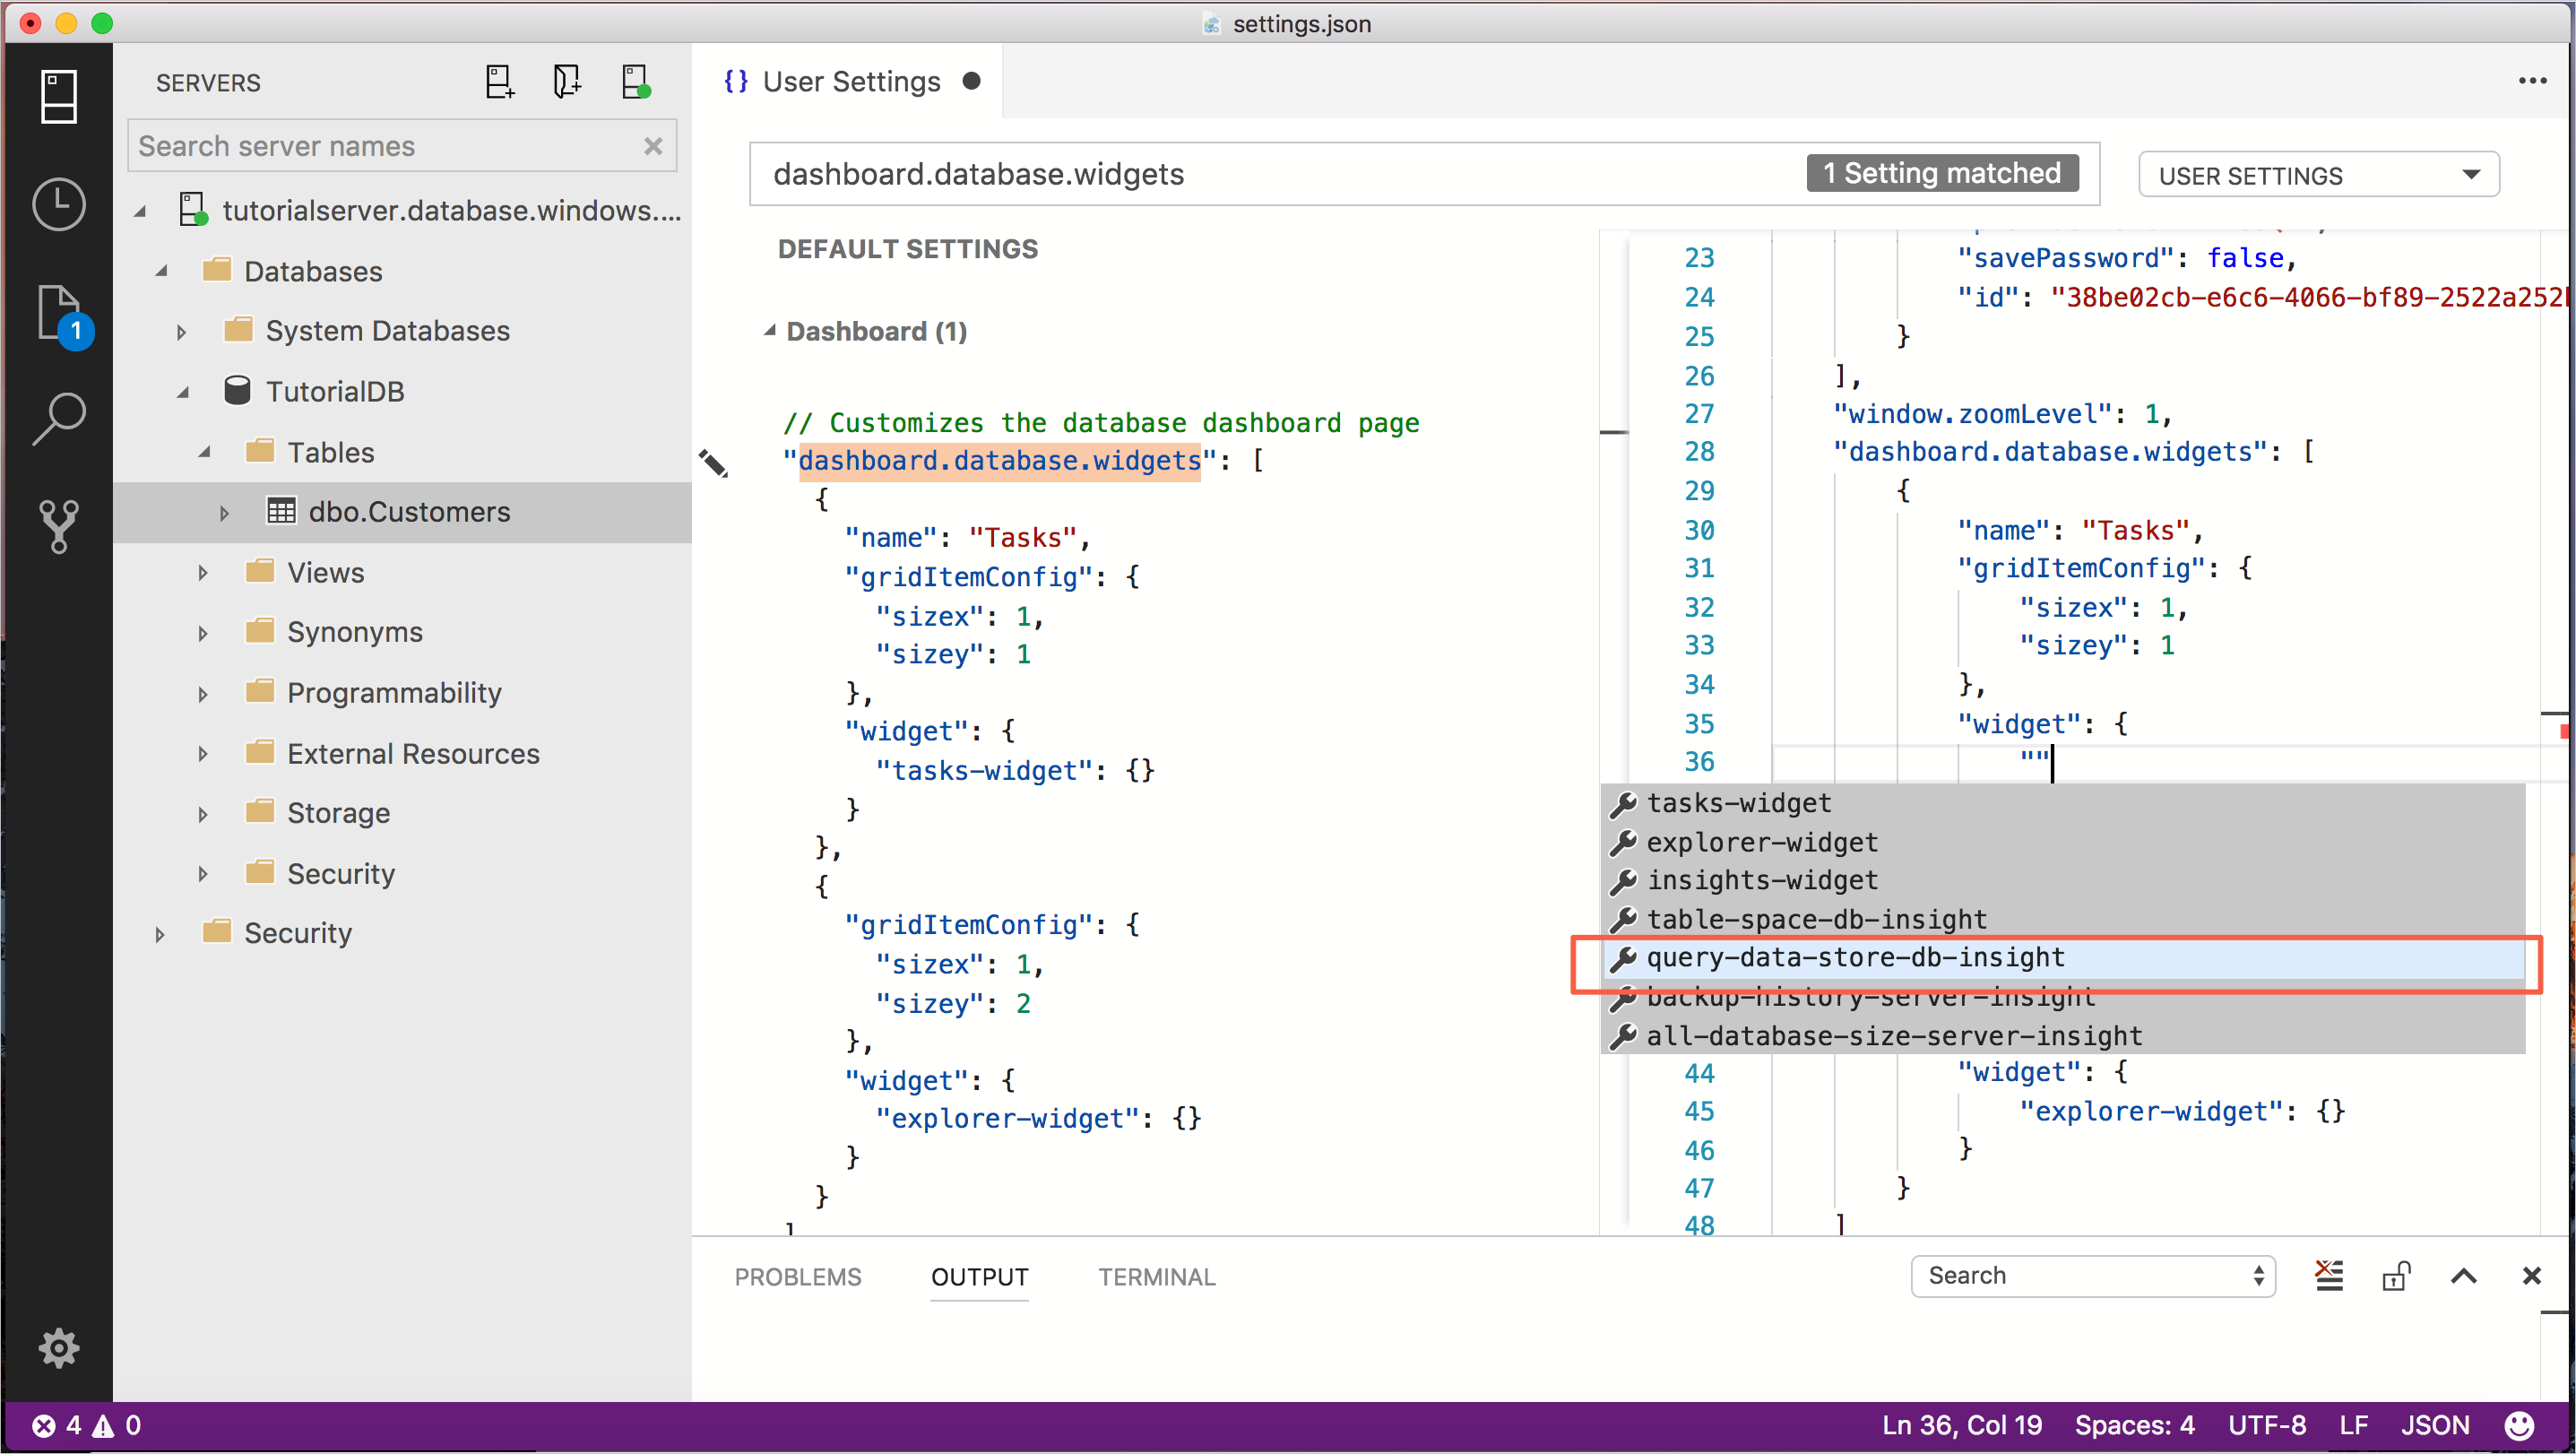
-
Press Ctrl+S to save the modified User Settings.
-
Open the Database dashboard by navigating to TutorialDB in the Servers sidebar, right-click, and select Manage.

-
The insight widget appears on the dashboard:


-
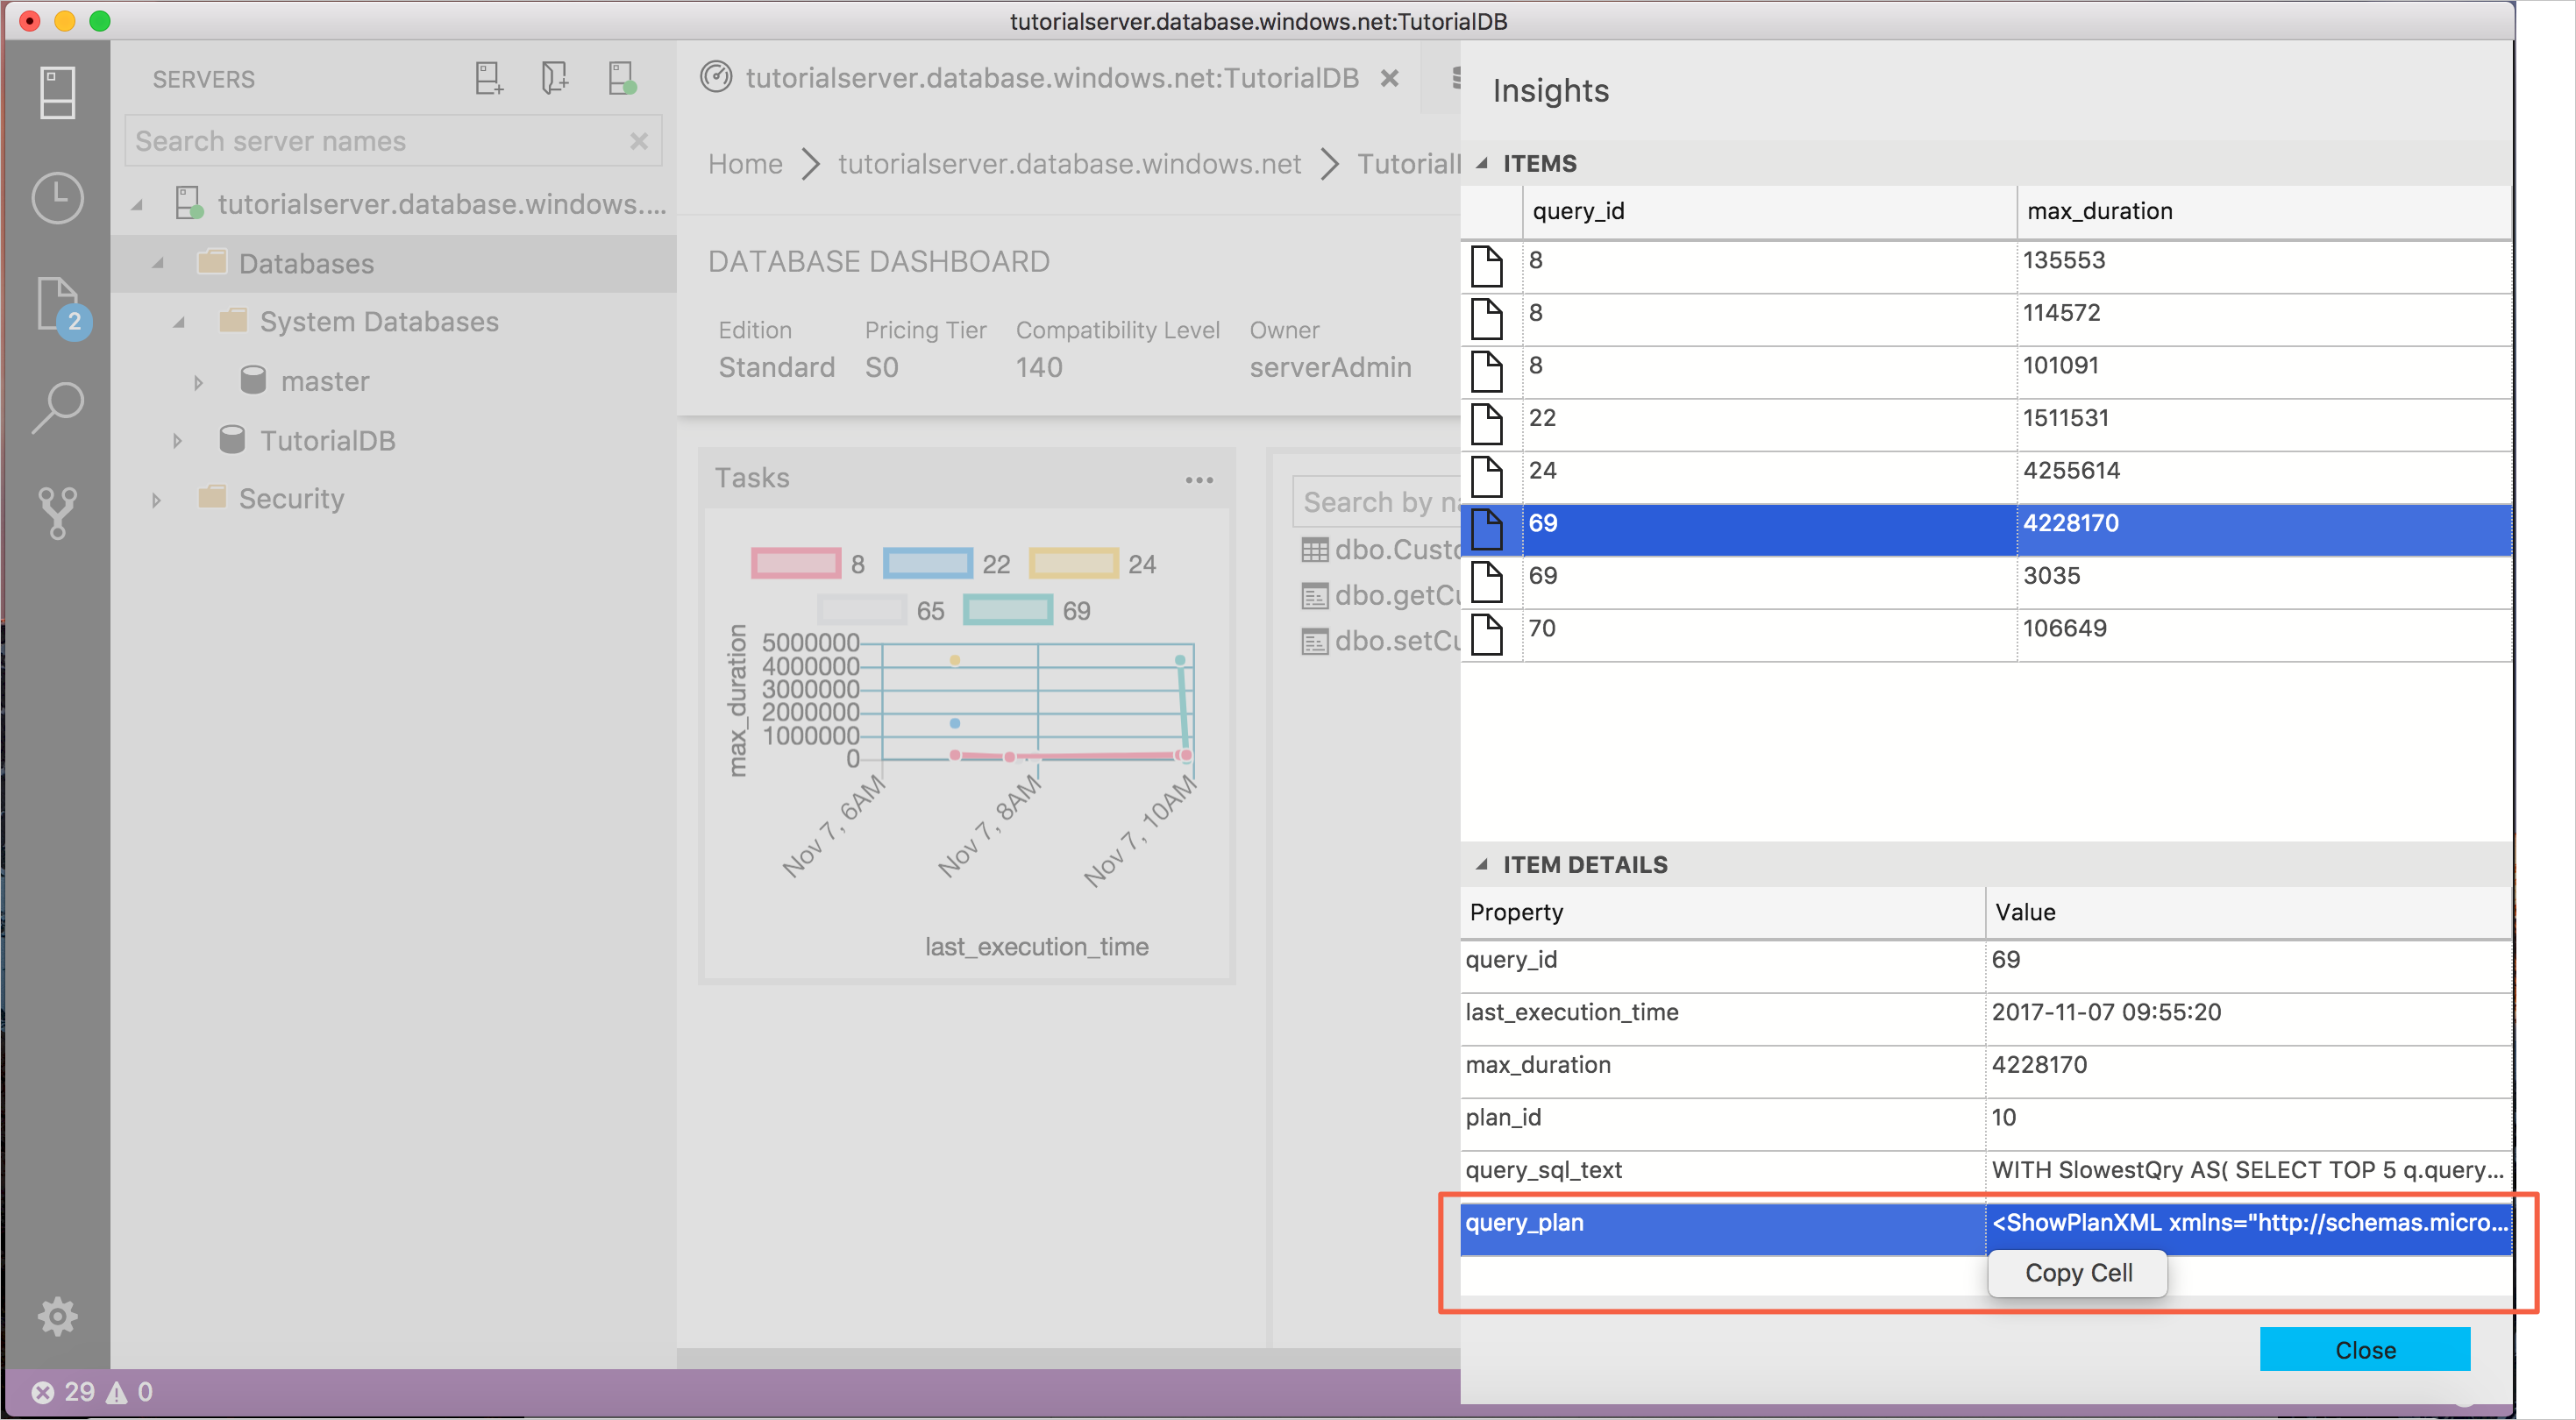
To view additional information for an insight widget, click the ellipses (...) in the upper right, and select Show Details.
-
To show more details for an item, select any item in Chart Data list.

-
Right-click query_sql_txt in Item Details and click Copy Cell.
-
Close the Insights pane.

-
Open a new query editor by pressing Ctrl+N.
-
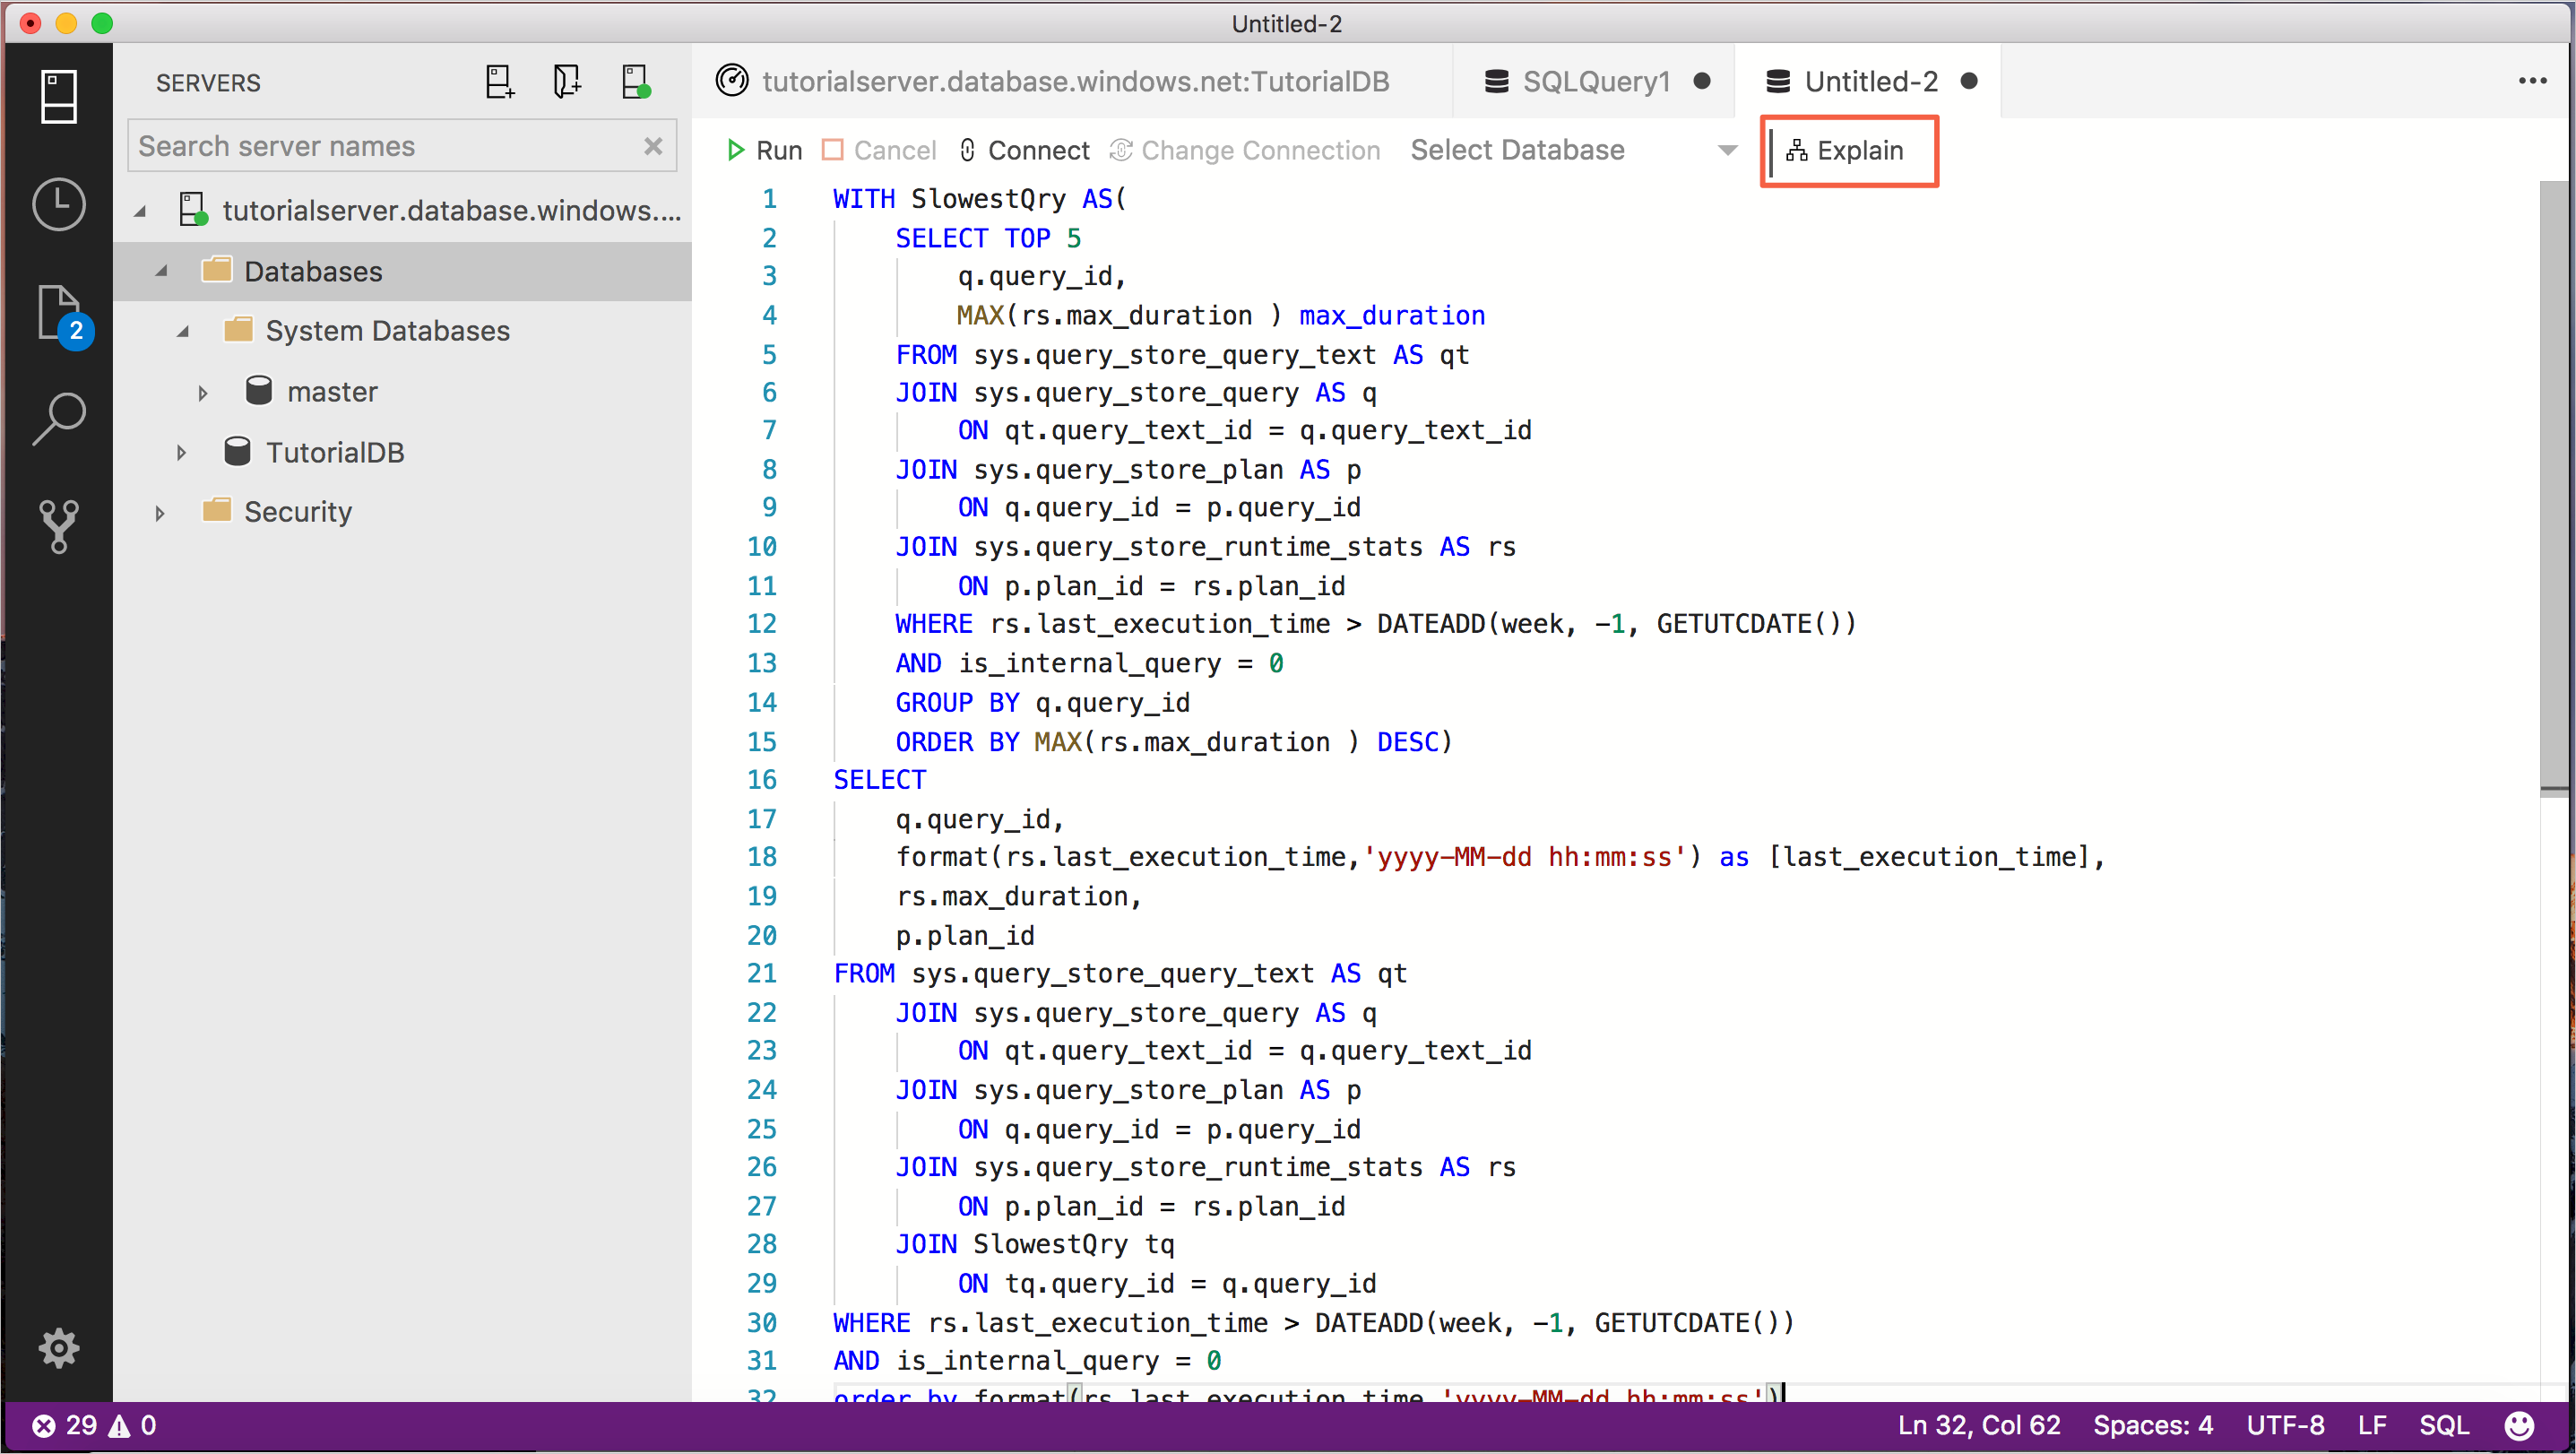
Paste the query text from the previous steps into the editor.
-
Click Explain.
-
View the query's execution plan:
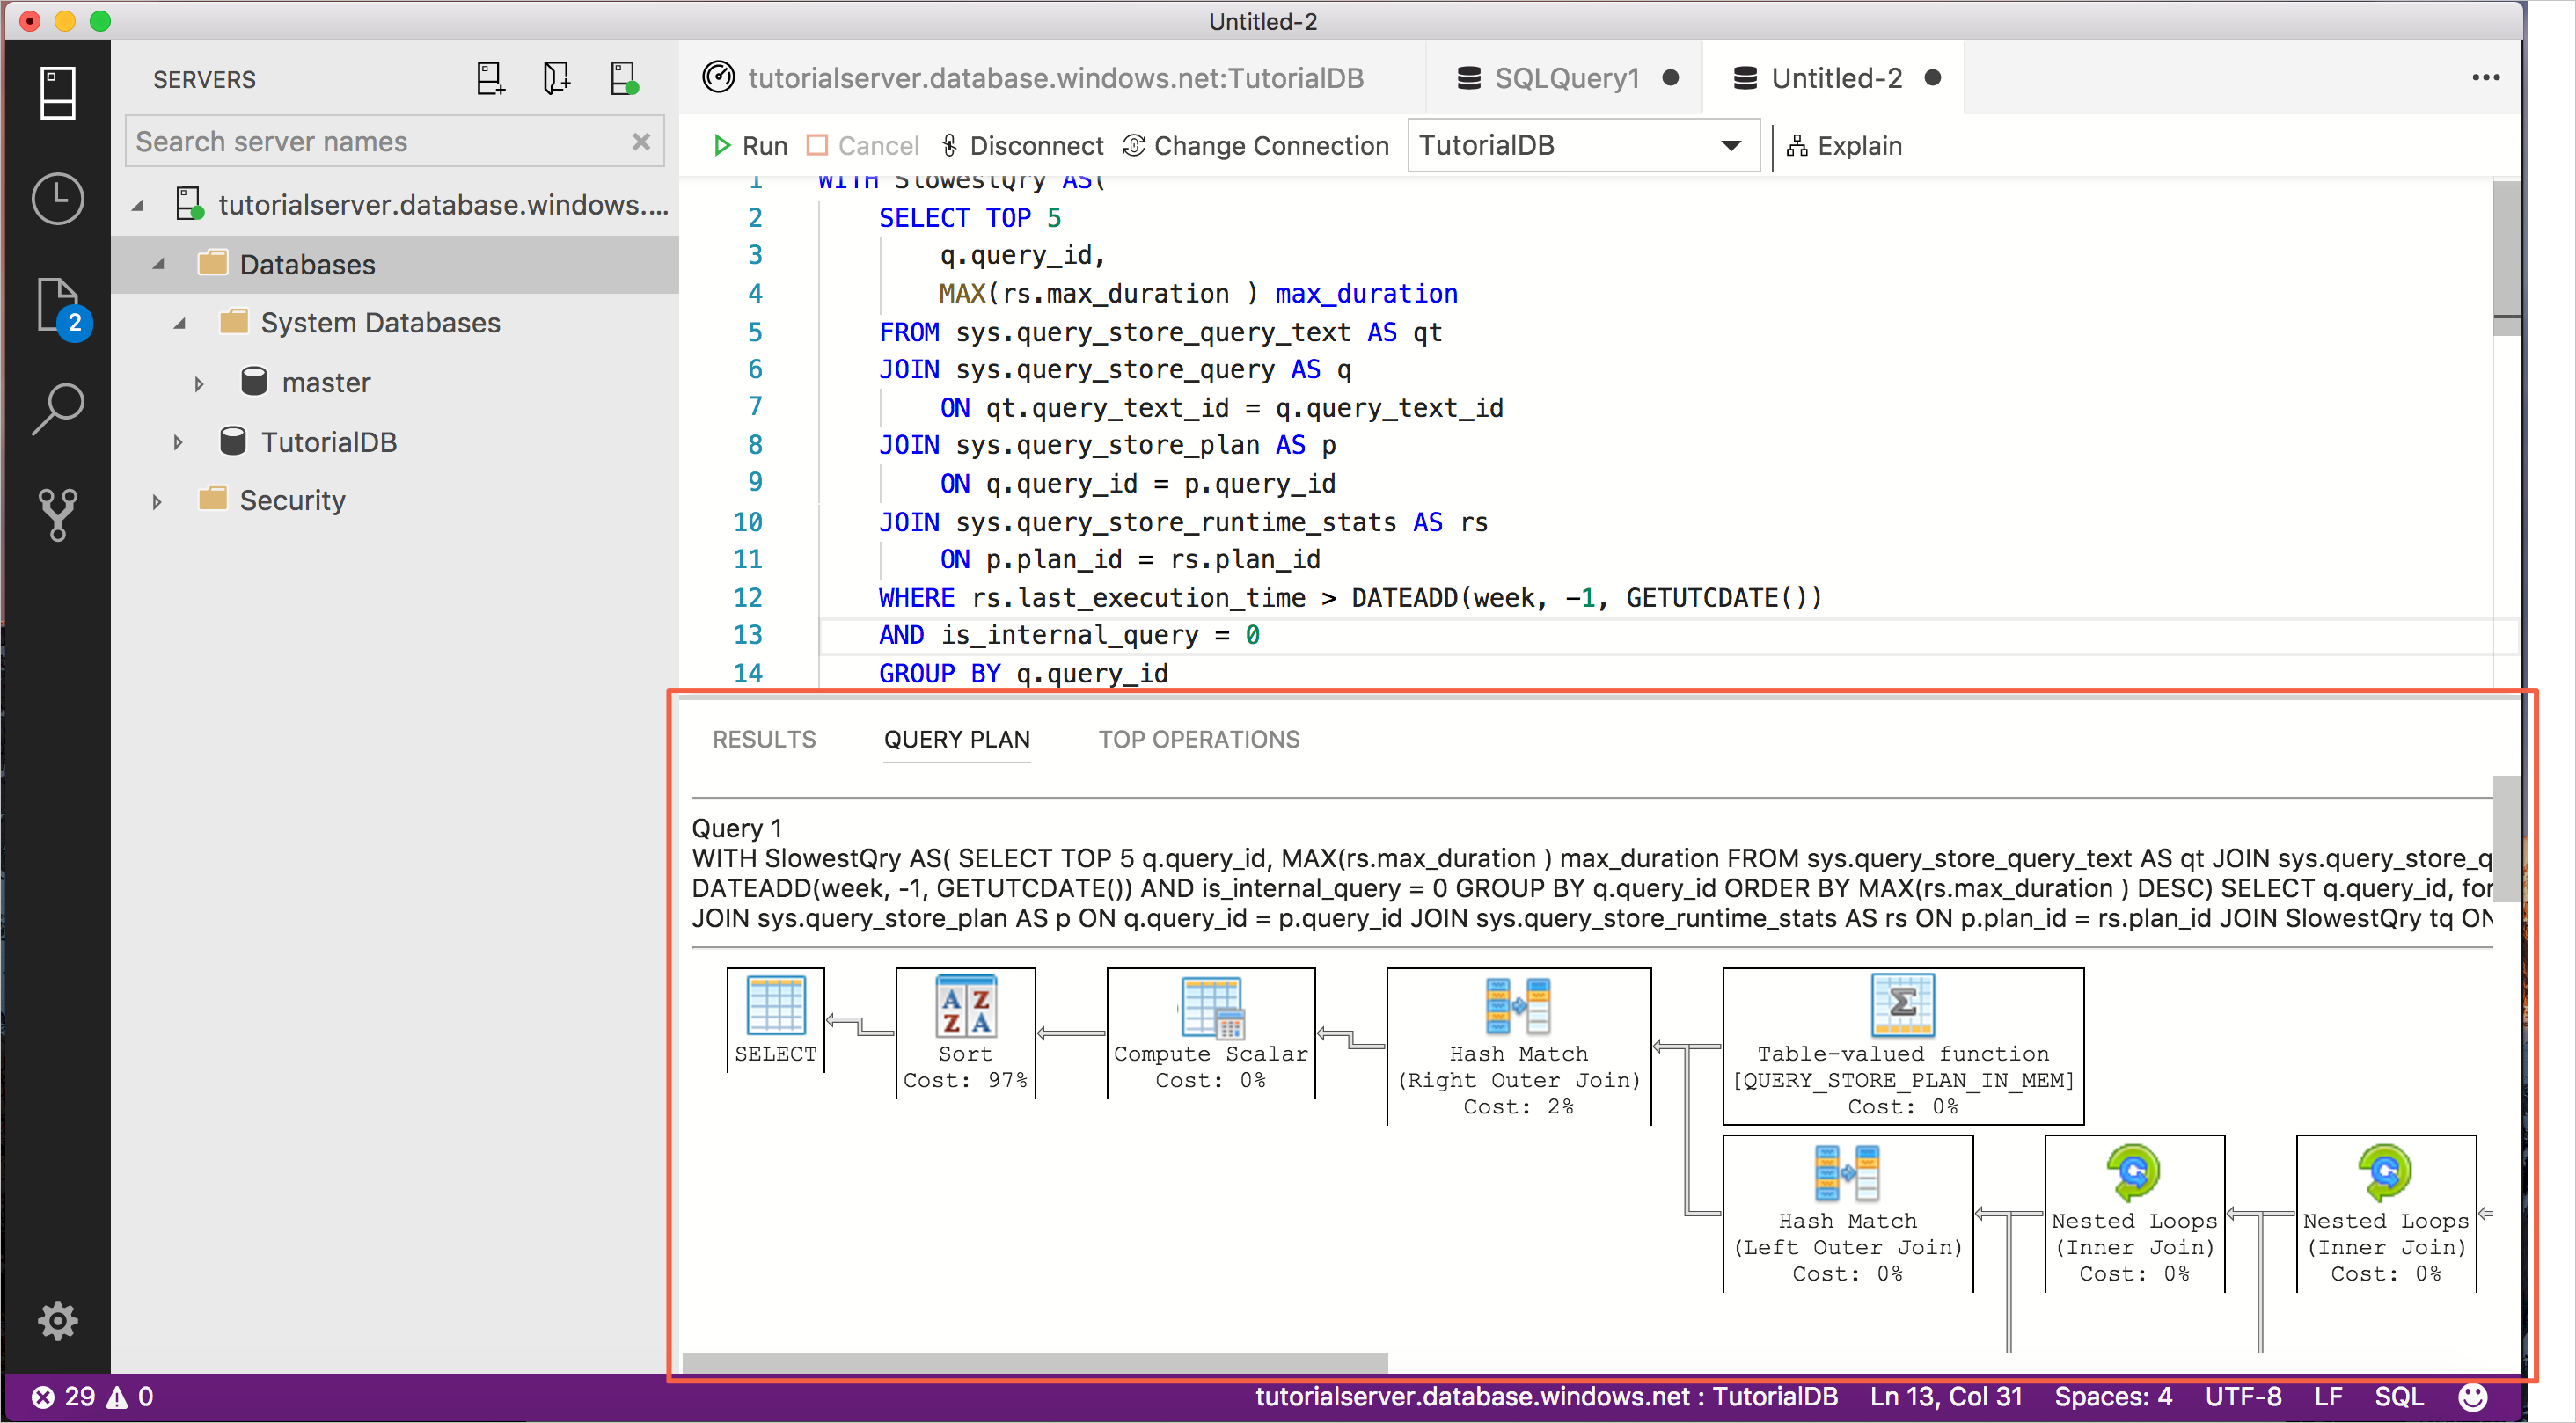


-
Open the insight detail dialog.
-
Select one of the query items.
-
Right-click query_plan value and select Copy Cell
-
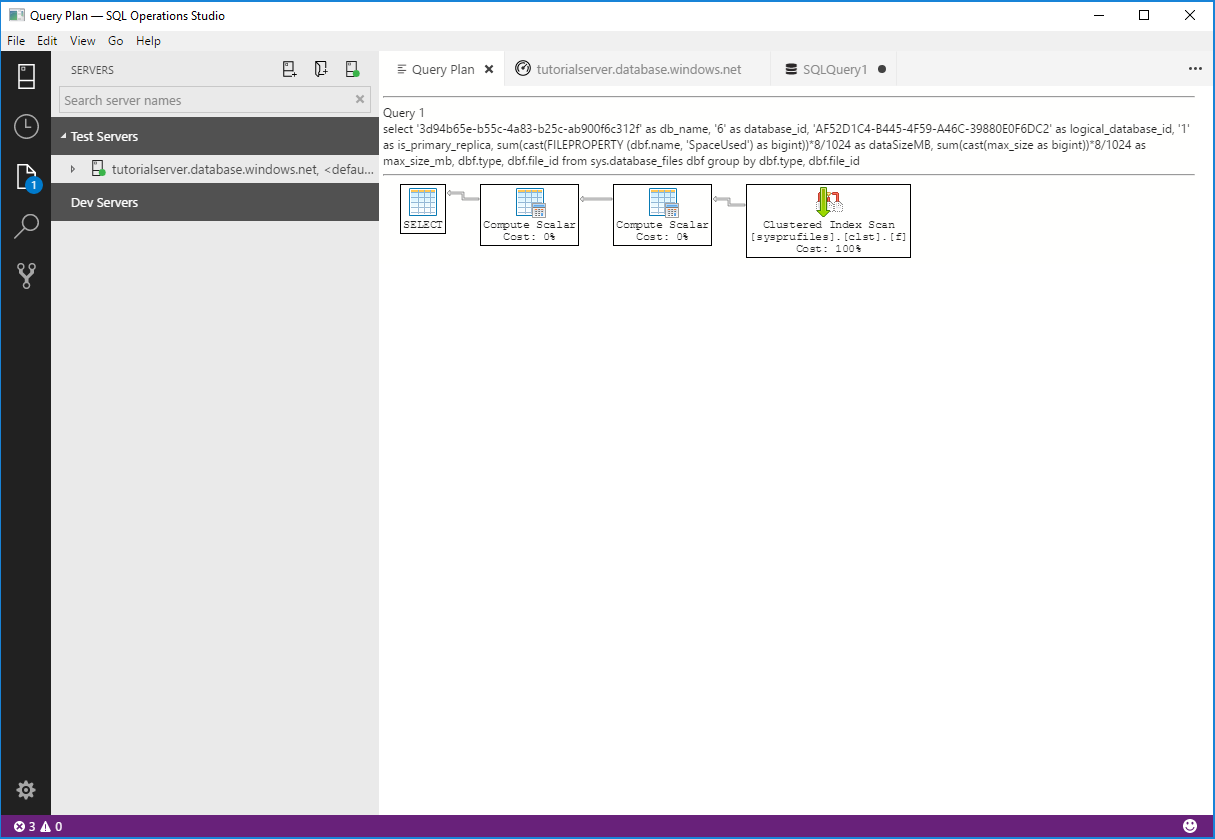
Press Ctrl+N to open a new editor.
-
Paste the copied plan into the editor.
-
Press Ctrl+S to save the file, and change the file extension to .sqlplan. For this tutorial, name the file slowquery.sqlplan.
-
The query plan opens in [!INCLUDEname-sos]'s query plan viewer:


In this tutorial, you learned how to:
[!div class="checklist"]
- Enable Query Store on a database
- Add an insight widget to the database dashboard
- View details about the database's slowest queries
- View query execution plans for the slow queries
To learn how to build a custom insight widget, see Build a custom insight widget.