| title | Tutorial: Build a custom insight widget in SQL Operations Studio (preview) | Microsoft Docs |
|---|---|
| description | This tutorial demonstrates how to build custom insight widgets and add them to database and server dashboards in SQL Operations Studio (preview). |
| ms.custom | tools|sos |
| ms.date | 11/15/2017 |
| ms.prod | sql |
| ms.reviewer | alayu; sstein |
| ms.suite | sql |
| ms.prod_service | sql-tools |
| ms.component | sos |
| ms.tgt_pltfrm | |
| ms.topic | tutorial |
| author | stevestein |
| ms.author | sstein |
| manager | craigg |
This tutorial demonstrates how to use your own insight queries to build custom insight widgets.
During this tutorial you learn how to:
[!div class="checklist"]
- Run your own query and view it in a chart
- Build a custom insight widget from the chart
- Add the chart to a server or database dashboard
- Add details to your custom insight widget
This tutorial requires the SQL Server or Azure SQL Database TutorialDB. To create the TutorialDB database, complete one of the following quickstarts:
- [Connect and query SQL Server using [!INCLUDEname-sos-short]](quickstart-sql-server.md)
- [Connect and query Azure SQL Database using [!INCLUDEname-sos-short]](quickstart-sql-database.md)
In this step, run a sql script to query the current active sessions.
-
To open a new editor, press Ctrl+N.
-
Change the connection context to TutorialDB.
-
Paste the following query into the query editor:
SELECT count(session_id) as [Active Sessions]
FROM sys.dm_exec_sessions
WHERE status = 'running'
-
Save the query in the editor to a *.sql file. For this tutorial, save the script as activeSession.sql.
-
To execute the query, press F5.
-
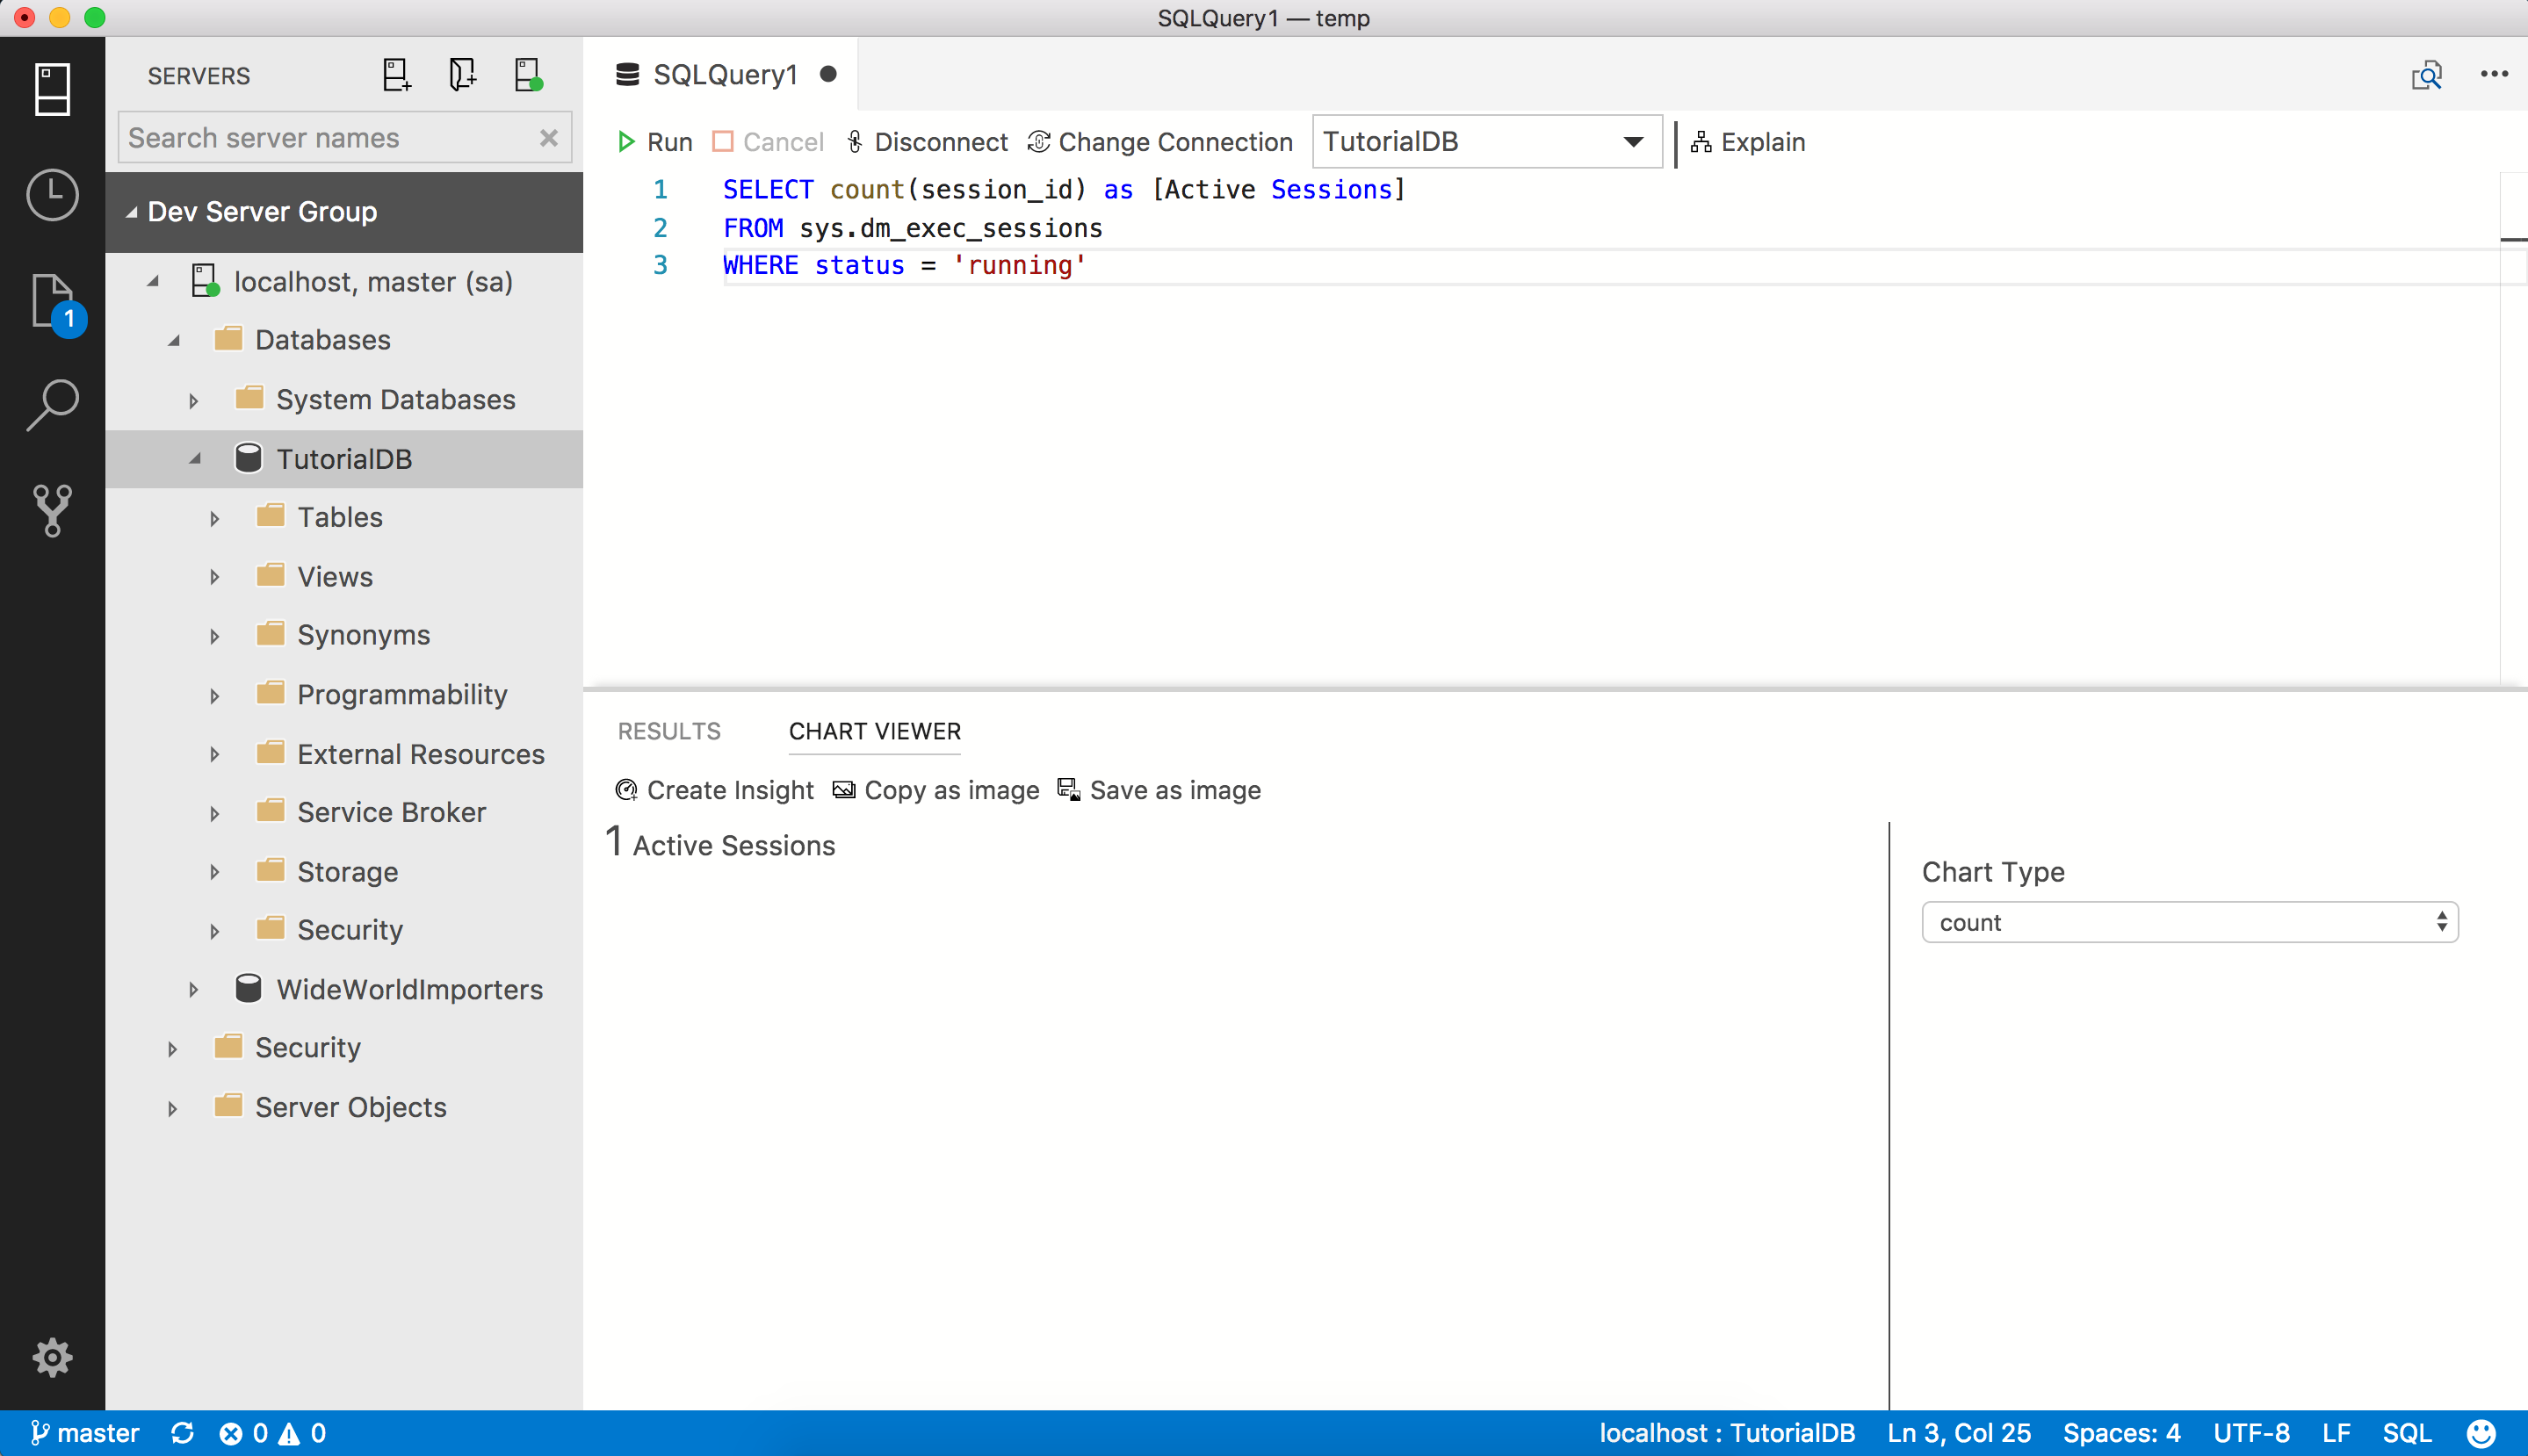
After the query results are displayed, click View as Chart, then click the Chart Viewer tab.
-
Change Chart Type to count. These settings render a count chart.
-
To open the insight widget configuration, click Create Insight on Chart Viewer:
-
Copy the insight configuration (the JSON data).
-
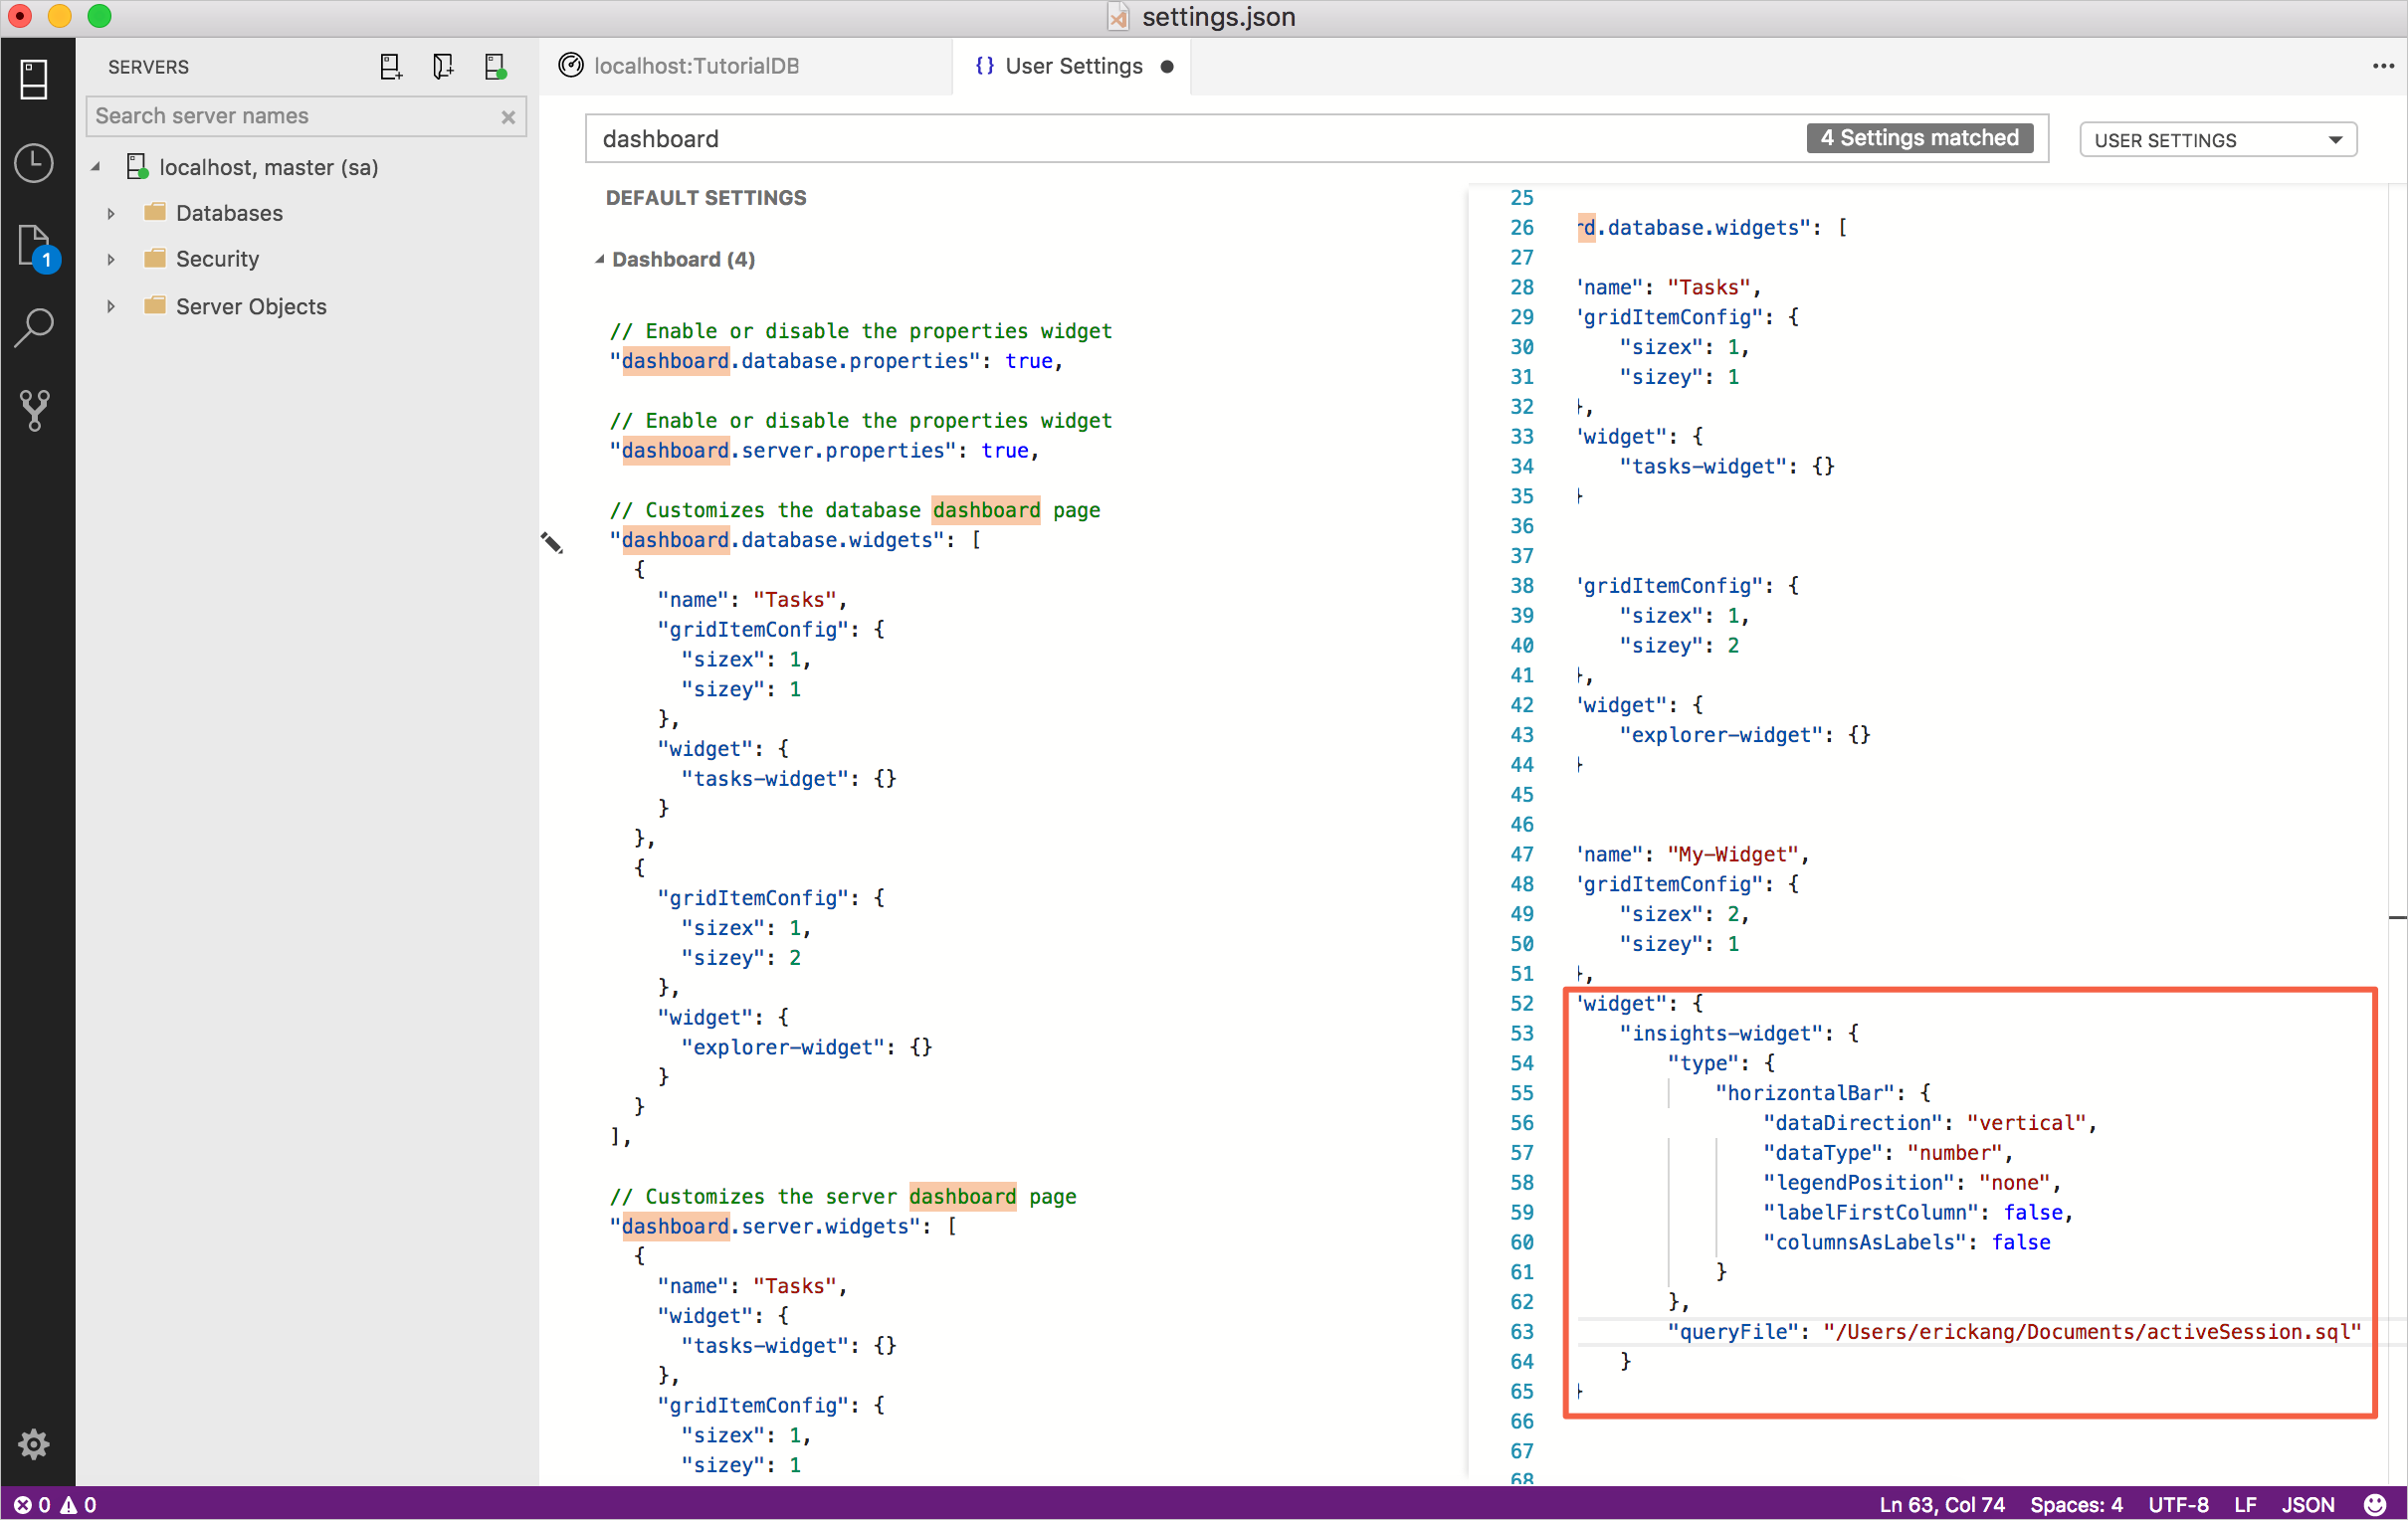
Press Ctrl+Comma to open User Settings.
-
Type dashboard in Search Settings.
-
Click Edit for dashboard.database.widgets.
-
Paste the insight configuration JSON into dashboard.database.widgets. Database dashboard settings looks like the following:
 "dashboard.database.widgets": [
     {
         "name": "My-Widget",
         "gridItemConfig": {
             "sizex": 2,
             "sizey": 1
         },
         "widget": {
             "insights-widget": {
                 "type": {
                     "count": {
                         "dataDirection": "vertical",
                         "dataType": "number",
                         "legendPosition": "none",
                         "labelFirstColumn": false,
                         "columnsAsLabels": false
                     }
                 },
                 "queryFile": "{your file folder}/activeSession.sql"
             }
         }
     }
 ]
-
Save the User Settings file and open the TutorialDB database dashboard to see the active sessions widget:


-
To open a new editor, press Ctrl+N.
-
Change the connection context to TutorialDB.
-
Paste the following query into the query editor:
 SELECT session_id AS [SID], login_time AS [Login Time], host_name AS [Host Name], program_name AS [Program Name], login_name AS [Login Name]
 FROM sys.dm_exec_sessions
 WHERE status = 'running'
-
Save the query in the editor to a *.sql file. For this tutorial, save the script as activeSessionDetail.sql.
-
Press Ctrl+Comma to open User Settings.
-
Edit the existing dashboard.database.widgets node in your settings file:
 "dashboard.database.widgets": [
     {
         "name": "My-Widget",
         "gridItemConfig": {
             "sizex": 2,
             "sizey": 1
         },
         "widget": {
             "insights-widget": {
                 "type": {
                     "count": {
                         "dataDirection": "vertical",
                         "dataType": "number",
                         "legendPosition": "none",
                         "labelFirstColumn": false,
                         "columnsAsLabels": false
                     }
                 },
                 "queryFile": "{your file folder}/activeSession.sql",
                 "details": {
                     "queryFile": "{your file folder}/activeSessionDetail.sql",
                     "label": "SID",
                     "value": "Login Name"
                 }
             }
         }
     }
 ]
-
Save the User Settings file and open the TutorialDB database dashboard. Click the ellipsis (...) button next to My-Widget to show the details:


In this tutorial, you learned how to:
[!div class="checklist"]
- Run your own query and view it in a chart
- Build a custom insight widget from the chart
- Add the chart to a server or database dashboard
- Add details to your custom insight widget
To learn how to backup and restore databases, complete the next tutorial:
[!div class="nextstepaction"] Backup and restore databases.